Measurements and Multimeter
https://www.fluke.com/en-us/learn/online-courses/digital-multimeter-basics-online-course
- Very complete video on How to use a multimeter like a pro! The Ultimate guide - Youtube by The Engineering Mindset
Exercises
In this exercise you will build and measure combined series-parallel resistor and capacitor networks on a breadboard. You are expected to have already completed the introductory component measurements covered in the handbook.
You should be comfortable reading resistor color codes/bands (4 Band Resistor Color Code Calculator), identifying capacitor markings (How to read the Capacitors markings? - Article by TME.eu), and operating the multimeter in resistance and capacitance modes before you begin.
The task here is to wire more complex multi-component circuits and collect, and report measured data. Analysis and reporting will follow in Assignment 1.
By the end of this exercise you should be able to:
- Wire a multi-component circuit correctly on a breadboard.
- Identify and measure the equivalent resistance or capacitance across the correct terminals.
- Collect repeated measurements systematically and record them in a table.
- Account and mitigate practical issues that affect measurement quality.
E1 Series and Parallel Resistor Circuits
Purpose: To build and measure the equivalent resistance of three different series and parallel resistor arrangements, and to collect the data needed to later compare measured results against predicted values.
Required Core Kit Components: From your core kit, you need:
- Breadboard
- 4 different sets of resistors
- 1 button
- Connecting wires (Jumper cables)
Additional Component:
- Digital multimeter (will be provided during the exercise).
Before you start:
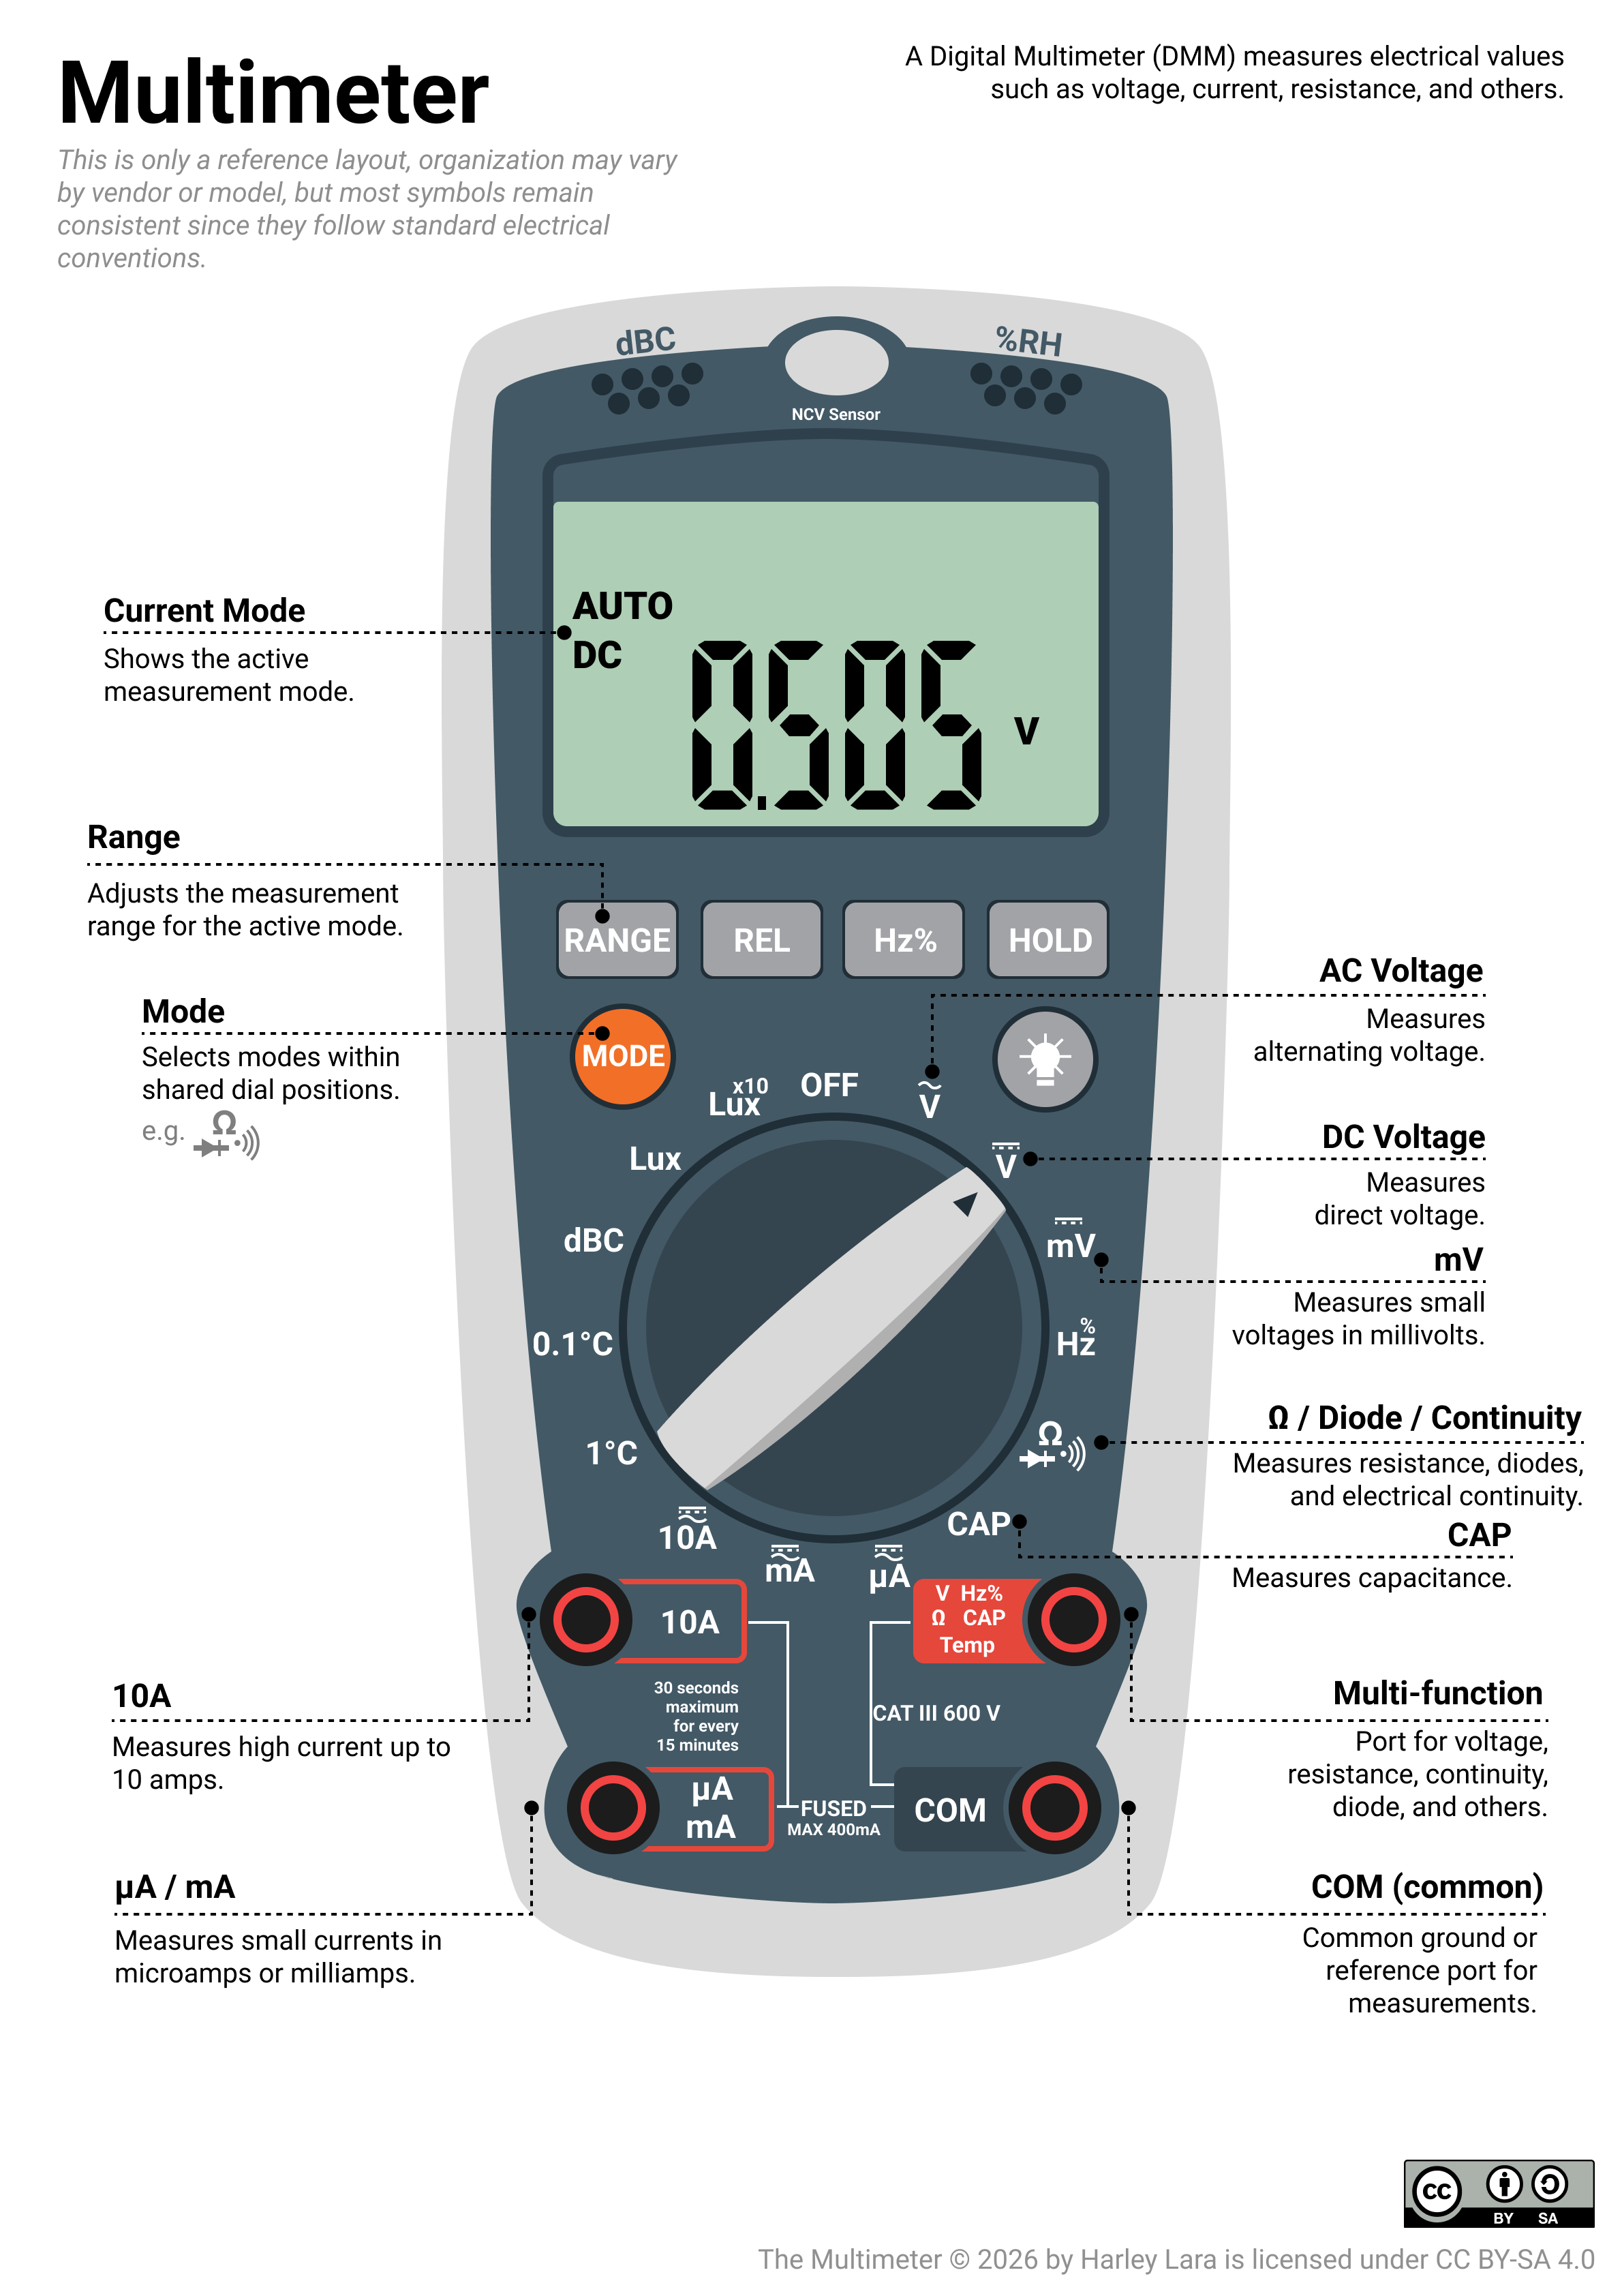
- Set the multimeter in resistance mode .
- Insert black probe in the "COM" terminal in the multimeter.
- Insert red probe in the terminal label as capable for resistance mode.
- Note: resistance measurement is not a directional type of measurement, therefore you can place the red and black probe in any order.
- Using Microsoft Excel or any other software for spreadsheets, create 4 tables with the following format:
| Measurement | Push-button state | A-B | A-C | B-C |
|---|---|---|---|---|
| 1 | [set the push-button state to ON or OFF if applicable otherwise leave it emtpy] | |||
| 2 | ||||
| 3 |
E1.1 Arrangement 1
 |
|---|
| Resistor arrangement 1 |
- Using your component and jumper cables, wire the circuit on the breadboard according to the schematic provided.
- Place the probes of the multimeter in a way that are in contact with test point pair A-B.
- Take three readings of the equivalent resistance and record each reading in the table. Between readings, lift the multimeter probe tips off the circuit, then place them back on the same test points.
- Repeat step 2 and 3 for test point pair A-C and B-C.
- Remove all components from the breadboard and put them back to their bag accordingly before proceeding to the next arrangement.
E1.2 Arrangement 2
 |
|---|
| Resistor arrangement 2 |
- Wire the circuit on the breadboard according to the schematic provided.
- Place the multimeter probes on the test point pair A-B.
- Take three readings of the equivalent resistance and record each reading in the table. Between readings, lift the multimeter probe tips off the circuit, then place them back on the same test points.
- Repeat step 2 and 3 but this time you push the button and hold while you record the readings.
- Remove all components from the breadboard and put them back to their bag accordingly before proceeding to the next arrangement.
E1.3 Arrangement 3
 |
|---|
| Resistor arrangement 3 |
- Wire the circuit on the breadboard according to the schematic provided.
- Place the multimeter probes on the test point pair A-B.
- Take three readings of the equivalent resistance and record each reading in the table. Between readings, lift the multimeter probe tips off the circuit, then place them back on the same test points.
- Repeat step 2 and 3 for test point pair A-C.
- Remove all components from the breadboard and put them back to their bag accordingly before proceeding to the next arrangement.
Checkpoint!: You have reached a checkpoint in the exercise, at this point you should already have 4 tables of measurement data.
E2 Series and Parallel Capacitor Circuits
Purpose: To repeat the same circuit-measurement approach with capacitors, observe their behaviour and learn how to measure the equivalent capacitance in the network.
Required Core Kit Components: From your core kit, you need:
- Breadboard
- 2 capacitors ( and )
- Connecting wires (Jumper cables)
Additional Component:
- Digital multimeter (will be provided during the exercise).
Before you start:
- Set the multimeter in capacitance mode.
- Insert black probe in the "COM" terminal in the multimeter
- Insert red probe in the terminal label as capable for capacitance mode.
- Note: capacitance measurement is not a directional type of measurement, therefore you can place the red and black probe in any order.
- Using Microsoft Excel or any other software for spreadsheets, create 4 tables with the following format:
| Measurement | A-B |
|---|---|
| 1 | |
| 2 | |
| 3 |
E2.1 Arrangement 1
 |
|---|
| Capacitors arrangement 1 |
- Wire the circuit on the breadboard according to the schematic provided.
- Place the multimeter probes on the test point pair A-B.
- Wait for the reading to stabilise before recording.
- Take three readings of the equivalent capacitance and record each reading in the table. Between readings, lift the multimeter probe tips off the circuit, then place them back on the same test points.
- Remove all components from the breadboard and put them back to their bag accordingly before proceeding to the next arrangement.
E2.2 Arrangement 2
 |
|---|
| Capacitors arrangement 2 |
- Wire the circuit on the breadboard according to the schematic provided.
- Stick the multimeter leads on the test point pair A-B.
- Wait for the reading to stabilise before recording.
- Take three readings of the equivalent capacitance and record each reading in the table. Between readings, lift the multimeter probe tips off the circuit, then place them back on the same test points.
- Remove all components from the breadboard and put them back to their bag accordingly before proceeding to the next arrangement.
Assignment
This assignment is a direct continuation of the exercises. You will use the data you collected in the exercise to perform quantitative analysis and answer discussion questions. No new measurements are required.
All numerical work should be completed using Microsoft Excel or any tools alike. Structure your spreadsheet clearly, one sheet per part is recommended. Your completed spreadsheet is the primary submission for this assignment.
A1 Series and Parallel Resistor Circuits
Step 1 - Reported measured values. For every test point pair in each arrangement, calculate:
- The mean resistance
- The standard deviation
- The uncertainty
- The fractional uncertainty (express as a percentage)
- The final reported value , rounded according to the significant figures rule.
Step 2 - Predicted equivalent resistances.
From the schematic of each arrangement, derive the formula for the equivalent resistance at each test point pair. Compute the predicted value using the nominal resistor values from the colour codes. Present your derivation clearly in your spreadsheet alongside the numerical result.
Step 3 - Discrepancy
For each test point pair in each arrangement, compute the discrepancy between your measured value and the nominal-based prediction. Summarise all results in a single table.
Discussion:
-
In arrangement 1, when measuring B–C, terminal A is left floating. Explain whether R1 contribute to that measurement, and verify that your prediction result reflects this.
-
In arrangement 2, and in this arrangement are all nominally . When identical resistors are in parallel, the equivalent resistance is the nominal resistance divided by , where is the number of resistors in the parallel network. Does your measured result (button held) agree with this expectation? If the discrepancy is low, what does this tell you about the consistency of the three resistors from the same batch?
-
In arrangement 3, all four resistors are nominally . Because of this symmetry, the A–C measurement has an especially clean predicted value. Does your measured result reflect this? If the four resistors were not all equal — say was , would the A–C measurement still be symmetric? Explain qualitatively what would change.
-
For which test point pair across all three arrangements was the fractional uncertainty the largest? Suggest a reason. Consider both the magnitude of the resistance being measured and any practical wiring issues that may have affected that particular measurement.
-
Let assume that a classmate argues that since the multimeter resolution is the same throughout the exercise, the uncertainty should be identical for every measurement. Do you agree? Under what circumstances would the standard deviation dominate instead?
A2 Series and Parallel Capacitor Circuits
Step 1 - Reported measured values.
For every test point pair in each arrangement, calculate:
- The mean capacitance
- The standard deviation
- The uncertainty
- The fractional uncertainty (express as a percentage)
- The final reported value , rounded according to the significant figures rule
Step 2 - Predicted equivalent capacitances.
From the schematic of each arrangement, derive the formula for the equivalent capacitance at the measured test point pair. Recall that the combination rules for capacitors are the reverse of those for resistors:
Step 3 - Discrepancy
For each test point pair in each arrangement, compute the discrepancy between your measured value and the nominal-based prediction. Summarise all results in a single table.
Discussion:
- In arrangement 1, and are in series between A and B, with nominal values of and respectively — a factor of 1000 apart. From your predicted equivalent capacitance, you should find that the result is almost entirely determined by C2 alone. Explain mathematically why the smaller capacitor dominates in a series combination, and state the general rule. How close is your measured result to the nominal value of C2 by itself? What does this imply about the practical usefulness of adding a very large capacitor in series with a very small one?
- Both the capacitors that you have in the core kit have wider tolerances than all the sets of resistors. How does this affect your confidence in the predicted values? Could large component tolerances alone explain a discrepancy ?
- Looking across all parts of this assignment, which single measurement had the largest fractional uncertainty? Which had the smallest? What do these two extremes tell you?
- Reflect on your Excel spreadsheet. If a classmate were to use it to reproduce your analysis starting from raw data, would it be clear enough? What would you change to make it more transparent?