Sensors and Signals
Sensors are the connection between a physical system and a digital system (like a microcontroller). A microcontroller cannot directly understand temperature, light, pressure, distance, humidity, acceleration, or sound. It can only work with electrical quantities such as voltage, current, resistance, logic levels, timing, and digital data.
For this reason, every sensing system requires a translation step. A physical quantity from the environment must be converted into a signal that can be interpreted by an electronic circuit. Once the signal is electrical, the microcontroller can measure it, process it, store it, transmit it, or use it to make decisions.
This chapter introduces the basic vocabulary needed to understand sensors and their signals. The goal is not to study every possible sensor in detail, but to make clear what kind of information a sensor produces and how that information reaches a microcontroller.
Definition: Sensor
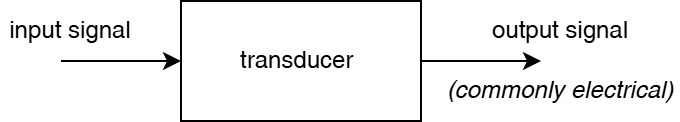
A sensor is a device that receives a physical, chemical, or biological stimulus and responds with a quantification of this stimulus in the form of a signal that can be interpreted, transmitted and/or stored. The device that performs this quantization is called a transducer.
Source: Taken from Chapter 1 of Harley's unpublished draft textbook on control systems. Influenced by Chapter 1, Data Acquisition Handbook of modern sensors.
Signal
Leaning into formalism, a signal would be described as a function or mapping from an index domain to a value space. However, we will leave the formalism to other courses, such as 8341 Analog and digital signal processing by Prof. Dr. Volker Strumpen and 8381 Control Engineering by Prof. Dr.-Ing. Rolf Becker and Harley Lara. For the sake of developing intuition, we will define a signal as a physical quantity that carries information.
In embedded systems, signals are usually discussed as electrical signals, but a signal does not have to be electrical at the beginning. A signal may first exist as heat, light, force, pressure, movement, sound, or chemical concentration. A sensor converts that physical input into a form that an electric or electronic system can use.
Let us motivate the opening discussion with an environmental variable such as temperature, which we can all easily experience and relate to. From personal experience and a few environmental cues, we can roughly infer the local temperature. In that sense, we can experience temperature directly.
A microcontroller, however, cannot interpret temperature in the same way. Although it can be affected by temperature and become hotter or colder depending on its environment, it cannot make sense of temperature as an external stimulus. The temperature must first be measured and represented as a electrical signal so that the microcontroller can process it and perform some form of operation with it.
There are many ways to measure temperature:
| Device | Input signal | Output signal |
|---|---|---|
| Mechanical thermometer | Thermal energy | Mechanical displacement |
| Bimetallic thermometer or thermograph | Thermal energy | Mechanical movement |
| Resistance thermometer, such as platinum or nickel RTD | Thermal energy | Change in electrical resistance |
| Thermistor | Thermal energy | Change in electrical resistance |
| Semiconductor temperature sensor | Thermal energy | Voltage, current, or digital data |
| Thermocouple | Temperature difference | Small electrical voltage |
These devices all respond to temperature, but they do not produce the same kind of output. A mercury or alcohol thermometer produces a visible mechanical displacement. A bimetallic thermometer bends a metal strip. A resistance thermometer changes resistance. A semiconductor temperature sensor may directly output a voltage or communicate a digital temperature value through a serial interface.
This distinction is important. The environmental variable is not automatically in a form that the microcontroller can use. The system needs a conversion mechanism.
Temperature measurement also depends on where the measurement is taken. Recall from the introductory chapter, particularly the section on Measurement principles and sources of error, that the measurand is not always fully defined. The VIM (International Vocabulary of Metrology) refers to the uncertainty caused by an incomplete definition of the measurand as definitional uncertainty.
This is why measuring air temperature is not the same as measuring the temperature of soil, water, a metal surface, or the inside of an enclosure. In each case, the sensor must be selected, positioned, and installed according to the target variable and the physical environment.
Common examples include:
- Air temperature, where the sensor must be exposed to the air but protected from direct heat sources or sunlight.
- Ground or soil temperature, where the sensor must be physically robust and often protected against moisture.
- Liquid temperature, where the sensor must be waterproof or placed inside a suitable probe.
- Surface temperature, where mechanical contact and thermal coupling become important.
The value measured by a sensor is therefore not only determined by the sensor itself. It is also affected by placement, packaging, contact with the environment, response time, and noise.
Transducers
A transducer is a device that converts one form of energy or signal into another.
In the context of sensors, a transducer usually converts a physical input into an electrical output. For example, a thermistor converts temperature into resistance, a photodiode converts light into current, and a microphone converts sound pressure into voltage.
 |
|---|
| Convert input signal to output signal using a transducer. |
The term sensor is often used broadly. In many practical contexts, people call the entire device a sensor, even if it contains several internal parts. Strictly speaking, a sensor module may include:
- the sensing element or transducer,
- signal-conditioning electronics,
- filters,
- amplifiers,
- an analog-to-digital converter,
- a digital communication interface,
- voltage regulation,
- calibration data,
- and sometimes local processing.
For example, a simple thermistor is only a sensing element. It changes resistance with temperature, but it does not directly provide a temperature value. A digital temperature sensor module, on the other hand, may contain the sensing element, analog circuitry, an ADC, calibration logic, and an I2C interface. From the programmer’s point of view, the module may simply return a temperature value in degrees Celsius.
This is why sensor terminology can be confusing. The word “sensor” may refer to a bare component, a complete integrated circuit, or a development-board-friendly module.
For microcontroller work, the practical question is usually:
What kind of signal does this sensor provide, and how can the microcontroller read it?
Electrical Signals
Once a physical variable has been converted into an electrical quantity, it can be handled by an electronic circuit. In embedded systems, the most common electrical quantities are voltage, current, resistance, frequency, pulse duration, and digital logic state. But is fair to mention that in the context of AMC we mainly work with voltage signals, pulse width modulation (PWM, more about in output devices), and digital logic states.
 |
|---|
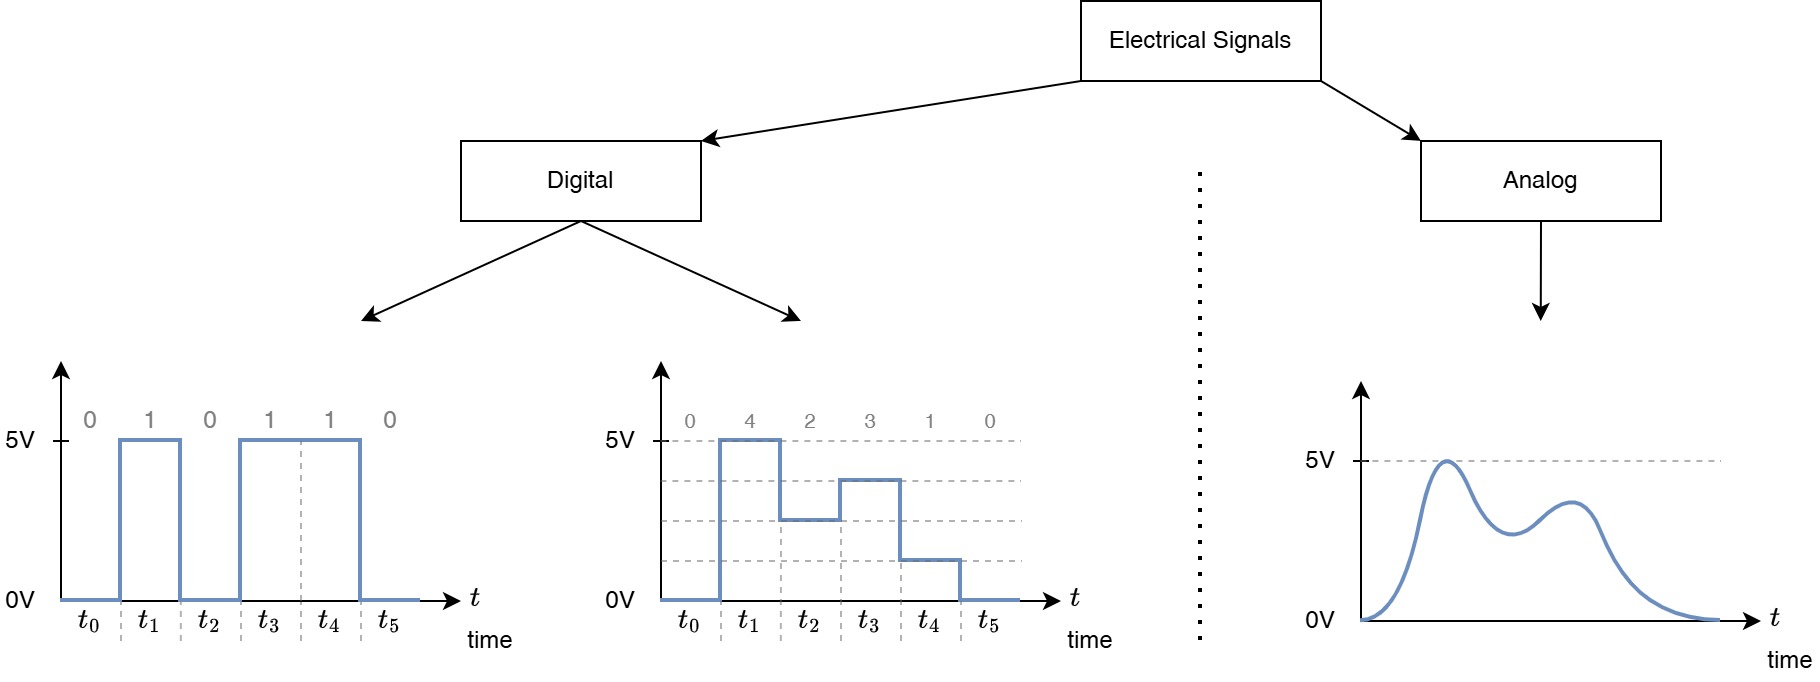
| Simple taxonomy of electrical signals. |
A useful first classification is the distinction between analog and digital signals.
An analog signal can vary continuously within a range. For example, a temperature sensor may output a voltage between 0 V and 3.3 V, where different voltages correspond to different temperatures. A microphone signal is also analog because the voltage changes continuously with sound pressure.
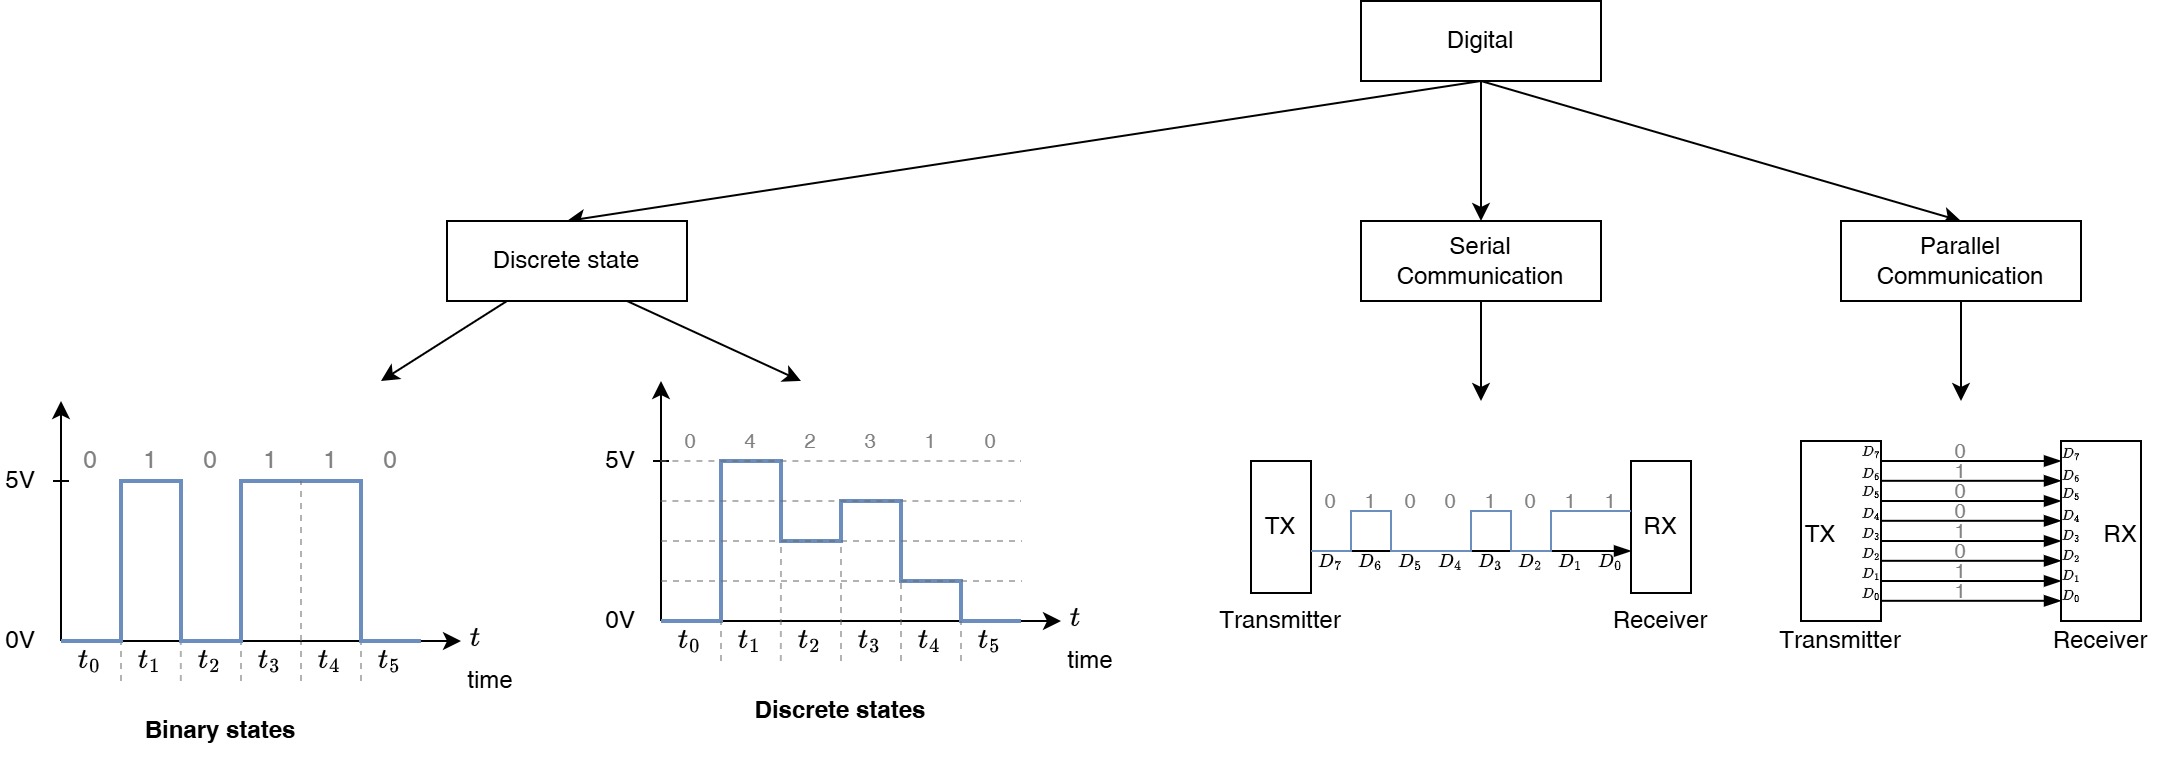
A digital signal uses discrete states. In microcontroller systems, these states are usually represented by voltage levels. A digital input pin does not interpret every possible voltage as a distinct value. Instead, it classifies the voltage as a logic low or a logic high.
Digital
A common misconception about the term digital is that it is not tangible, or that it lives inside a computer. It is sometimes used as a synonym for "virtual", but the reality is that, in loose words, digital just means discrete. Take, for example, your local ice cream shop. They sell a set of flavors from which you can choose. In that sense, we could say they have "digital flavors", clearly, no one would ever say that, but the semantics of the sentence is correct: they offer a discrete set of flavors.
Drawing from Prof. Becker’s lecture in Applied Measurement and Control – Digital I/O –, we can reflect on the etymology of the word digital:
Latin digitus : finger
Digital data, in information theory and information systems, are discrete, discontinuous representations of information or works, as contrasted with continuous, or analog signals which behave in a continuous manner, or represent information using a continuous function.
From here, we could formalize digital from a mathematical point of view and use set theory to define it more rigorously. However, we will leave that task to 8112 Mathematics: Analysis and discrete mathematics by Malte Weber.
For AMC, the takeaway is that digital does not only mean zero and one, or high and low. Rather, any discrete quantization of information or signals can be considered digital.
Discrete States and Logic Levels
Digital systems represent information using discrete states. The simplest digital representation is binary: two possible states, usually called 0 and 1.
In electronic circuits, these states are implemented using voltage ranges. A microcontroller pin does not receive an abstract 0 or 1; it receives a voltage level. The input circuitry then decides whether that voltage should be interpreted as a logic low or a logic high.
But how does an electronic circuit decide whether a voltage level represents a zero or a one? That is a good question, and the full answer is a bit outside the scope of AMC. However, if you want to explore this topic in more detail, you can check Transistor–transistor logic - Wikipedia.
Side note: About picking the right level of abstraction
Very often, it is hard for a professor, instructor, or lecturer not to teach something in great detail. It is tempting to jump straight into all the cool circuits and explanations behind TTL and complementary metal–oxide–semiconductor, commonly known as CMOS, and how they are used in logic circuits.
This is why it is very important that I, as the instructor, decouple myself from what I want to teach from what you, the learner, actually need to know. Of course, I would like to dive deeply into TTL and CMOS technology, but it is important for an instructor to assess wisely the right level of complexity and depth depending on the learner’s background.
Clearly, this is not about neglecting details or complex topics through oversimplification. Rather, it is about choosing the right level of abstraction and leaving the door open for further exploration, with extra resources and references for the more curious learner.
 |
|---|
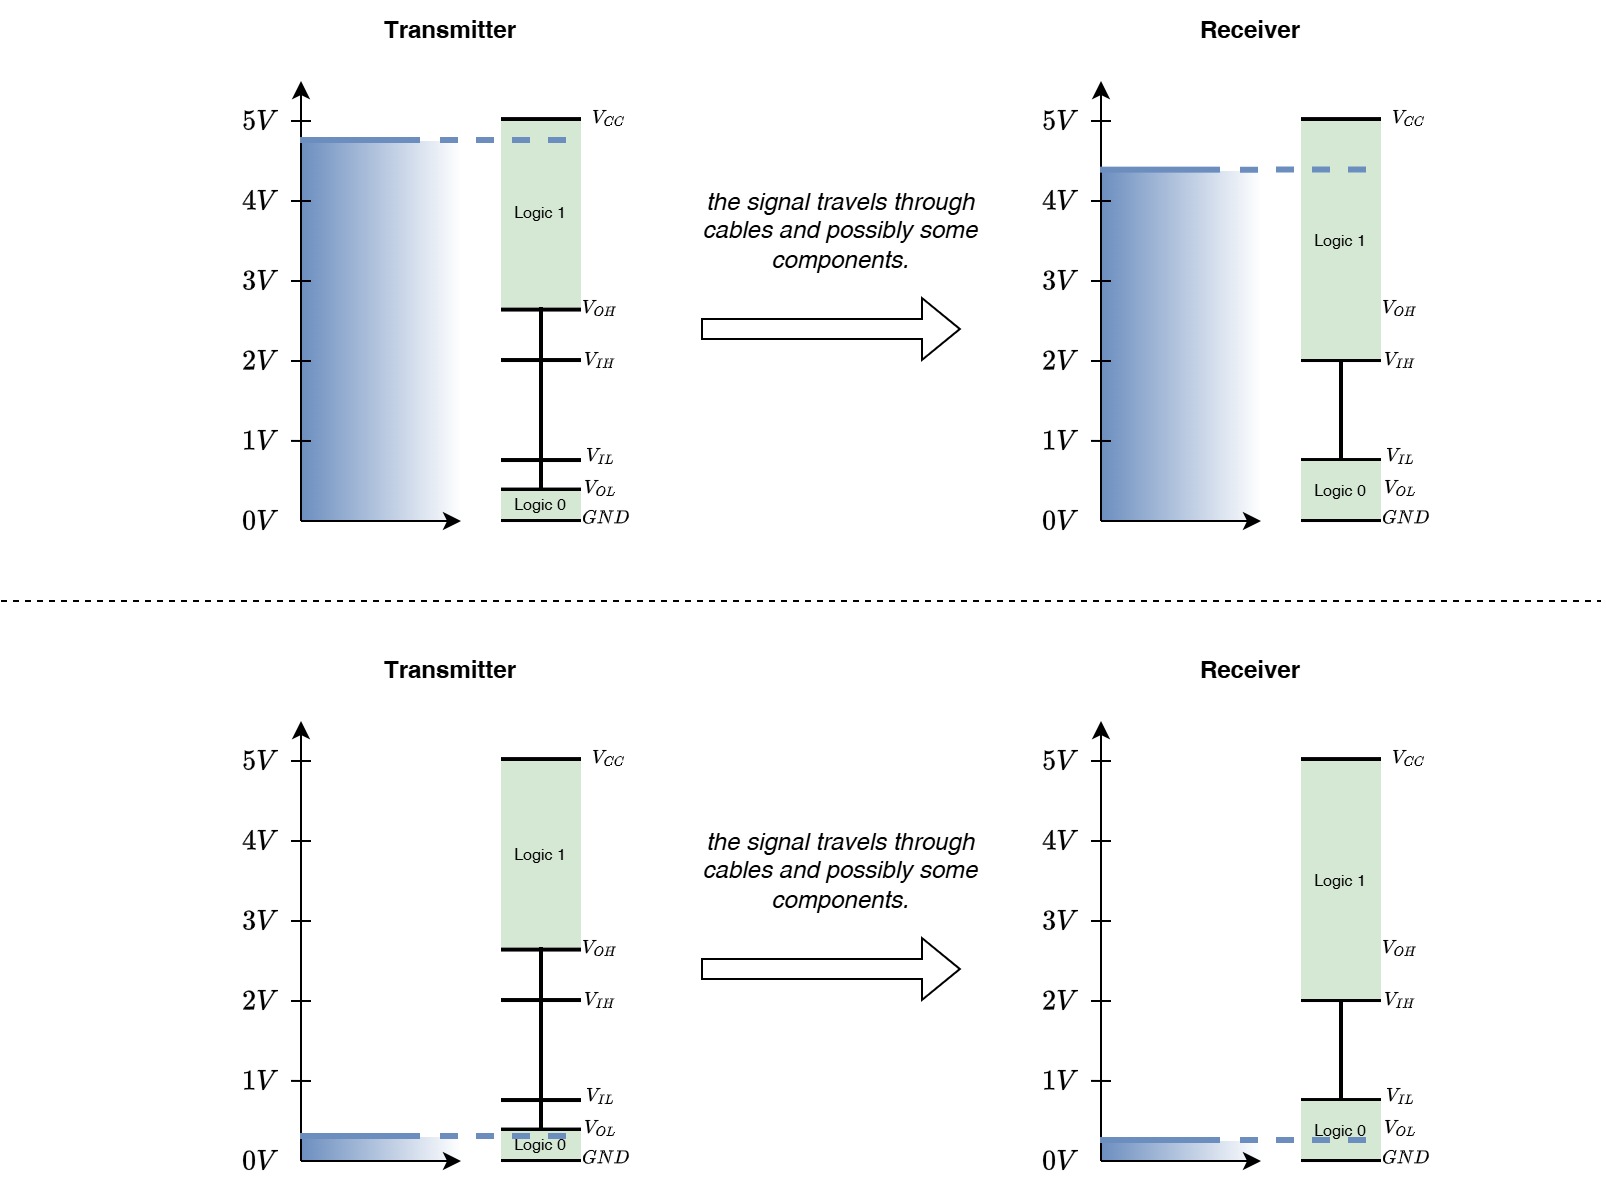
| Illustrative example of how voltage levels are interpreted as logic states in TTL systems. |
Take, for example, the microcontroller in the AMC Core Kit. It is an ESP32 microcontroller, which operates with 3.3 V logic levels. This means that:
- a voltage close to 0 V is interpreted as logic low,
- a voltage close to 3.3 V is interpreted as logic high,
- voltages in between may be undefined or unreliable.
It is important to mention that the exact thresholds depend on the specific microcontroller. The illustration above shows some reference thresholds for , , and . However, to obtain the exact values, you must always check the microcontroller datasheet, where input voltage levels, output voltage levels, and logic-family compatibility are specified.
Common logic-level families include:
| Logic context | Typical voltage level |
|---|---|
| Older TTL logic | 5 V system, TTL-specific thresholds |
| 5 V CMOS logic | 0 V and 5 V |
| 3.3 V CMOS logic | 0 V and 3.3 V |
| Low-power modern logic | 1.8 V, 1.2 V, or lower |
In microcontroller projects, the most common concern is whether a sensor module uses 5 V logic or 3.3 V logic. A 5V signal connected directly to a 3.3V-only input can damage the microcontroller. Similarly, a 3.3 V output may not always be recognized as high by a 5 V device, depending on the input threshold.
Therefore, before connecting a digital sensor, it is necessary to check:
- the sensor supply voltage,
- the sensor logic voltage,
- the microcontroller input tolerance,
- whether pull-up resistors are required,
- and whether level shifting is necessary.
The fact that there is a wide variety of digital sensors does not guarantee safe compatibility. Assuming that all digital sensors are compatible simply because they are digital is incorrect, and it can lead to damage to the microcontroller or the sensor.
Remember that digital only means that information is represented using discrete states. The voltage levels used to represent and interpret those states may vary from one device to another.
Pull-up and Pull-down
 |
|---|
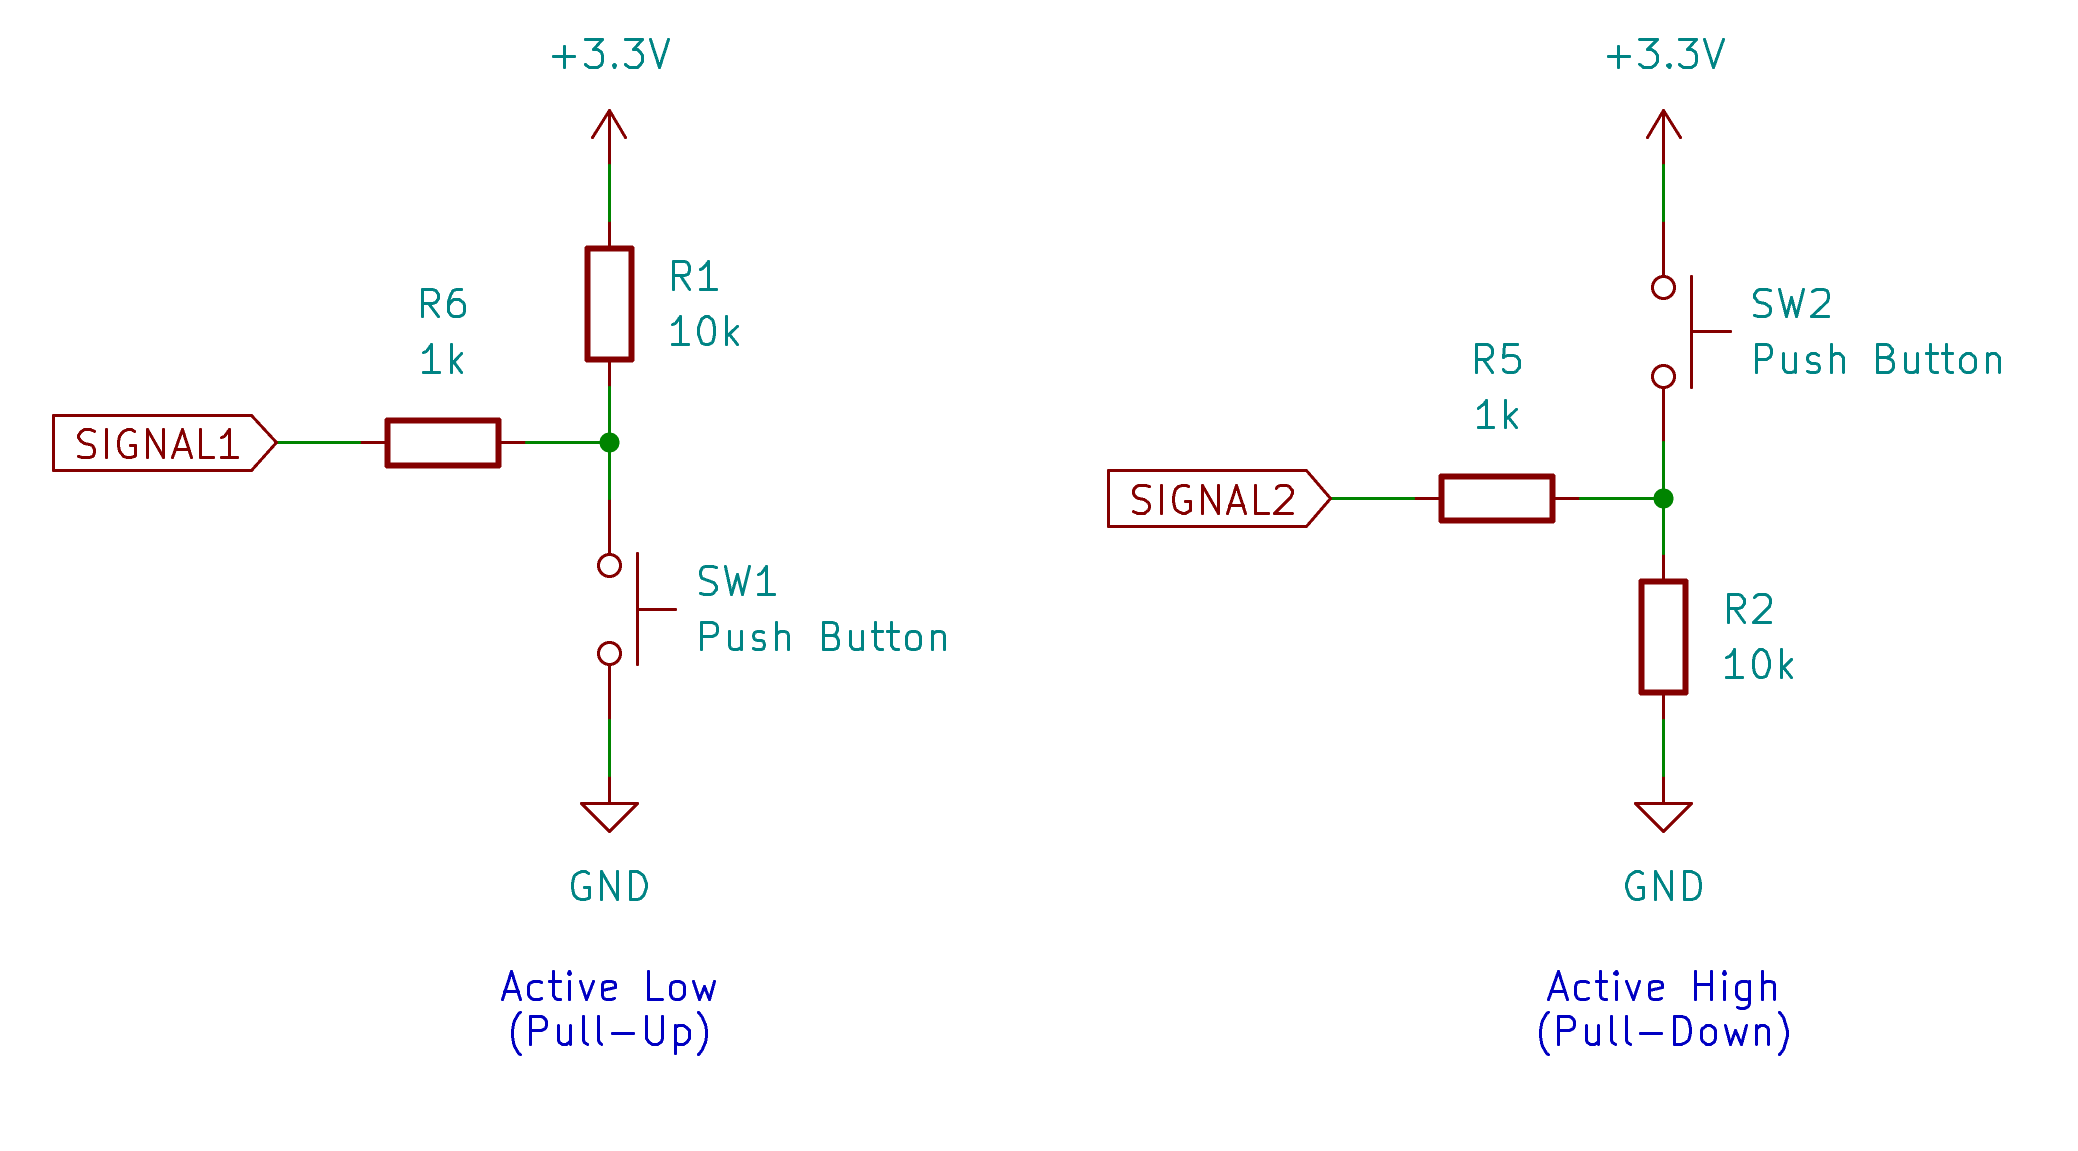
| Pull-up and pull-down circuits. |
| Pull-up resistor | Pull-down resistor |
|---|---|
Information Representation
A single digital signal can represent a simple state, such as whether a button is pressed. However, most useful sensor data requires more than one bit of information.
For example, a temperature value such as 23.75 °C cannot be represented by one logic high or one logic low. It must be encoded using multiple bits. These bits may be stored in memory, transmitted over a digital bus, or interpreted according to a format defined in a datasheet.
A digital sensor therefore needs a data representation. The sensor may send:
- an integer value,
- a signed value,
- a fixed-point value,
- a floating-point value,
- a status register,
- a configuration register,
- calibration coefficients,
- or multiple bytes that must be combined by software.
For example, a digital temperature sensor may not directly send the text 23.75. Instead, it may send two bytes. The program must combine those bytes, apply scaling, and convert the result into a physical unit.
This is why reading a digital sensor is not only an electrical problem. It is also a data interpretation problem.
The datasheet defines how the bits should be understood.
From Analog to Digital
Microcontrollers are digital computers. Their CPU, memory, and program logic operate on binary values. However, many physical sensors produce analog signals. To process these signals in software, the analog signal must be converted into a digital representation.
This conversion is performed by an analog-to-digital converter, usually abbreviated as ADC.
An ADC measures an analog voltage and converts it into a number. For example, a 12-bit ADC can represent the input using 4096 possible values, from 0 to 4095. If the ADC reference voltage is 3.3 V, then:
0corresponds approximately to 0 V,4095corresponds approximately to 3.3 V,- values in between correspond to voltages between 0 V and 3.3 V.
The ADC does not measure every possible voltage with infinite precision. It divides the voltage range into discrete steps. This process is called quantization.
The number of available steps depends on the ADC resolution:
| ADC resolution | Number of possible values |
|---|---|
| 8-bit | 256 |
| 10-bit | 1024 |
| 12-bit | 4096 |
| 16-bit | 65536 |
Higher resolution allows smaller voltage differences to be represented, but resolution alone does not guarantee accuracy. Noise, reference voltage stability, sensor quality, circuit layout, calibration, and sampling method also affect the final measurement.
The second important concept is sampling. Sampling means measuring the signal at specific points in time. A slowly changing signal, such as room temperature, may only need to be sampled once per second or even less often. A fast-changing signal, such as audio or vibration, requires a much higher sampling rate.
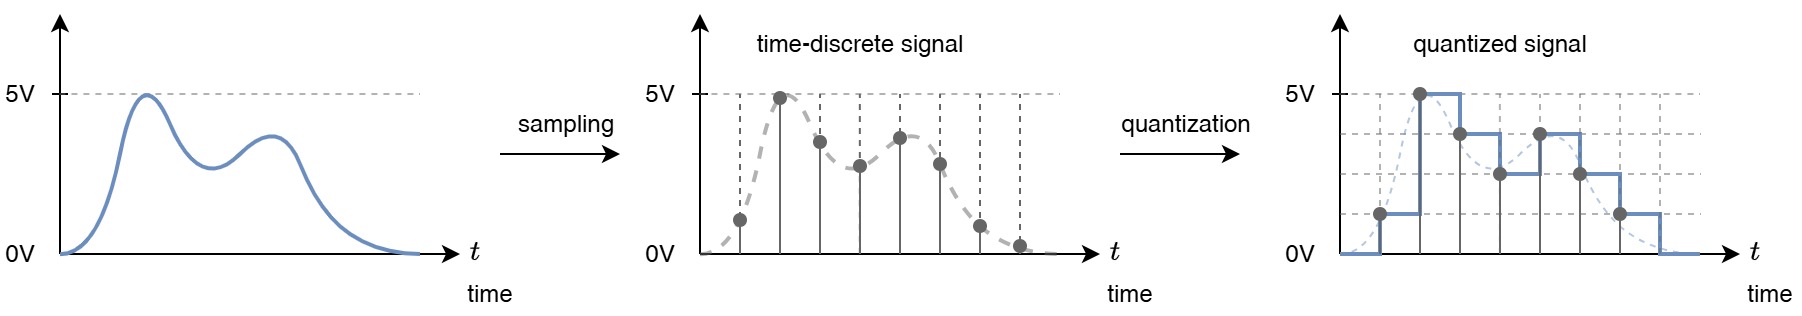 |
|---|
| Process of digital signal processing (DSP). |
After the signal is sampled and converted into numbers, it can be processed in software. This may include:
- averaging multiple samples,
- filtering noise,
- detecting thresholds,
- calculating physical units,
- compensating for calibration errors,
- detecting peaks or changes,
- and making decisions based on the measured value.
This general process is often related to digital signal processing, or DSP. In small microcontroller projects, DSP may be as simple as averaging ten ADC readings. In more advanced systems, it may involve filters, frequency analysis, sensor fusion, or real-time control.
Analog Sensors
An analog sensor provides an output that varies continuously with the measured quantity. The microcontroller usually reads this signal using an ADC.
Common analog sensors and sensing circuits include:
| Sensor or circuit | Measured quantity | Typical electrical output |
|---|---|---|
| Potentiometer | Position or user input | Variable voltage |
| Photoresistor voltage divider | Light level | Variable voltage |
| Thermistor voltage divider | Temperature | Variable voltage |
| Analog temperature sensor | Temperature | Voltage proportional to temperature |
| Microphone amplifier module | Sound pressure variation | Time-varying voltage |
| Soil moisture probe | Approximate soil conductivity | Variable voltage |
| Force-sensitive resistor circuit | Force or pressure | Variable voltage |
Analog sensors are often simple to connect, but they require careful interpretation. The ADC value is not automatically the physical value. Software must convert the ADC reading into voltage and then convert the voltage into the target unit.
For example, with a 12-bit ADC and a 3.3 V reference:
voltage = adc_value * 3.3 / 4095
After that, the voltage must be converted according to the sensor behavior. For some sensors, the relationship is approximately linear. For others, such as thermistors and photoresistors, the relationship is nonlinear.
This is why calibration and datasheets matter. The microcontroller receives a number, but the meaning of that number depends on the sensor and the circuit around it.
Digital Signals
A digital signal uses discrete voltage states, but digital information can be represented in different ways.
 |
|---|
| Simple taxonomy of digital signals. |
Some digital sensors provide a simple on/off output. For example, a motion detector may output high when motion is detected and low when no motion is detected. A magnetic reed switch may behave like a digital input that changes state when a magnet is nearby.
Other sensors encode information using timing. For example, an ultrasonic distance sensor may send a pulse whose duration corresponds to the measured distance. In this case, the signal is digital in voltage level, but the information is contained in time.
More complex digital sensors communicate using serial protocols. Instead of representing the measurement with one voltage or one pulse, they transmit structured data as a sequence of bits.
This distinction is important:
| Digital signal type | Example | What the program reads |
|---|---|---|
| Single logic state | Button, switch, motion detector | 0 or 1 |
| Pulse duration | Ultrasonic distance sensor | Time interval |
| Pulse frequency | Rotation sensor, flow sensor | Count or frequency |
| Serial data | I2C, SPI, UART, 1-Wire sensor | Bytes, registers, packets |
Digital sensors are often easier to use at the application level because they may already provide calibrated or partially processed data. However, they require correct communication setup and correct interpretation of the protocol.
Digital Serial Communication
Digital serial communication transmits data one bit at a time over one or more signal lines. This allows a microcontroller to exchange structured data with sensors, displays, memory devices, radios, and other integrated circuits.
 |
|---|
| Simple taxonomy of digital serial communication. |
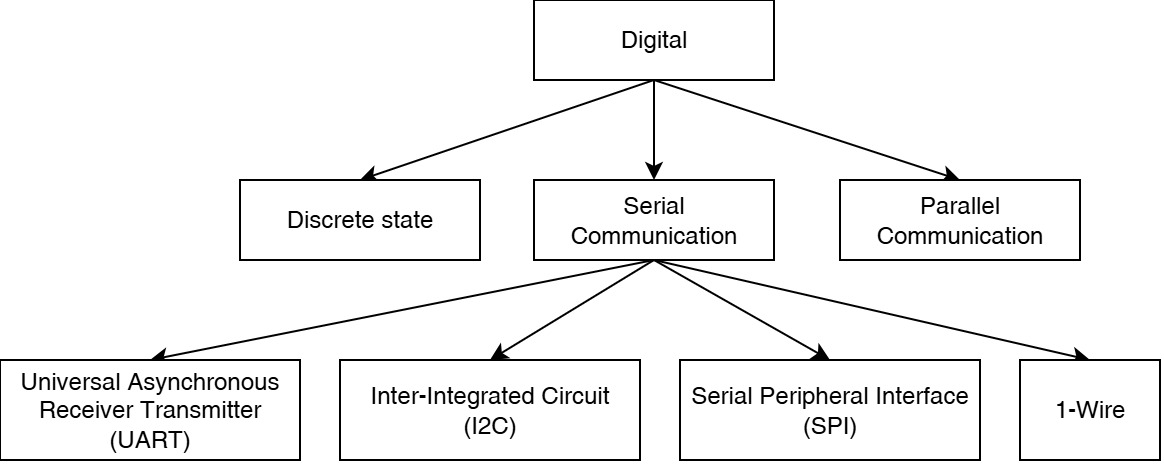
The most common digital communication interfaces used with sensors are:
- I2C
- SPI
- UART
- 1-Wire
Each interface has different electrical and software requirements.
I2C
I2C is a two-wire bus commonly used for sensors and small peripherals. It uses one line for data, usually called SDA, and one line for clock, usually called SCL.
Multiple devices can share the same I2C bus as long as they have different addresses. This makes I2C convenient when several sensors must be connected to the same microcontroller.
Typical I2C sensors include:
| Sensor example | Measured quantity |
|---|---|
| BME280 or BMP280 | Temperature, pressure, humidity depending on model |
| SHT31 | Temperature and humidity |
| MPU6050 | Acceleration and angular velocity |
| VL53L0X | Distance |
| TSL2561 or BH1750 | Light intensity |
| AS5600 | Magnetic angle |
I2C usually requires pull-up resistors on the data and clock lines. Many sensor modules already include these resistors, but this should not be assumed without checking the module documentation.
SPI
SPI is a high-speed synchronous interface. It usually uses separate lines for clock, data from controller to peripheral, data from peripheral to controller, and chip select.
The common SPI signal names are:
| Signal | Meaning |
|---|---|
SCK | Serial clock |
MOSI | Main output, secondary input |
MISO | Main input, secondary output |
CS or SS | Chip select or slave select |
SPI is often faster than I2C, but it usually requires more wires. Each SPI device typically needs its own chip-select line.
Typical SPI devices include:
| Device example | Purpose |
|---|---|
| SD card module | Data storage |
| MAX6675 or MAX31855 | Thermocouple interface |
| MCP3008 | External ADC |
| Some accelerometers and IMUs | Motion sensing |
| Some displays | Visual output |
SPI is useful when higher data rates are required, but the wiring and device selection must be managed carefully.
UART
UART is an asynchronous serial interface. It usually uses one transmit line and one receive line:
| Signal | Meaning |
|---|---|
TX | Transmit |
RX | Receive |
Unlike I2C and SPI, UART does not use a shared clock line. Both devices must be configured to use the same baud rate and frame format.
UART is common for modules that behave like independent subsystems. Examples include GPS receivers, some wireless modules, serial sensors, and debugging interfaces.
Typical UART devices include:
| Device example | Purpose |
|---|---|
| GPS module | Position and time |
| CO2 sensor module | Gas concentration |
| Bluetooth serial module | Wireless serial communication |
| Some fingerprint sensors | Biometric input |
| Debug adapter | Program output and diagnostics |
UART is conceptually simple, but it is not normally used as a shared multi-device bus. A single UART connection is usually point-to-point.
1-Wire
1-Wire is a communication protocol that uses a single data line plus ground. Devices can often be connected on the same bus, and each device has a unique address.
A common example is the DS18B20 digital temperature sensor. This sensor is popular because it can be used with long cables and is available in waterproof probe packages.
1-Wire is slower than I2C or SPI, but it can be practical when wiring simplicity is more important than speed.
Digital Sensors
A digital sensor is a sensor that provides information using digital signaling. This does not necessarily mean that the original measurement is digital. In most cases, the physical measurement is still analog inside the device. The difference is that the sensor package performs the analog measurement internally and then exposes the result through a digital interface.
For example, a digital temperature sensor may contain:
- a temperature-sensitive element,
- analog measurement circuitry,
- an ADC,
- calibration memory,
- internal compensation logic,
- and an I2C interface.
From the microcontroller’s point of view, the sensor is read by requesting one or more registers. The sensor returns bytes, and the program converts those bytes into a temperature value.
Common digital sensor modules include:
| Sensor/module | Interface | Typical measured quantity |
|---|---|---|
| BME280 | I2C or SPI | Temperature, humidity, pressure |
| BMP280 | I2C or SPI | Temperature and pressure |
| SHT31 | I2C | Temperature and humidity |
| DS18B20 | 1-Wire | Temperature |
| MPU6050 | I2C | Acceleration and angular velocity |
| VL53L0X | I2C | Distance |
| BH1750 | I2C | Light intensity |
| MAX31855 | SPI | Thermocouple temperature |
| GPS module | UART | Position and time |
| MH-Z19 style CO2 sensor | UART or PWM depending on module | Carbon dioxide concentration |
Digital sensors can reduce the amount of analog circuit design required by the user. They may also provide better repeatability because the manufacturer controls the internal analog design and calibration. However, this does not remove the need to understand the interface, timing, voltage levels, and data format.
When using a digital sensor, always check:
- supply voltage,
- logic voltage,
- communication protocol,
- device address or chip-select behavior,
- required pull-up resistors,
- measurement range,
- resolution,
- accuracy,
- sampling rate,
- register map,
- and library assumptions.
A library can simplify the software, but it does not replace understanding the electrical connection.
Sensor Modules
Many sensors used in prototyping (including AMC) are not bare sensing elements. Instead, they are mounted on small printed circuit boards, often called sensor modules, just modules or breakout boards.
For example, the CdS photoresistor and the DS18B20 included in the AMC Core Kit can be used with relatively little supporting circuitry. The CdS photoresistor is a simple sensing element whose resistance changes with light. The DS18B20 is a packaged digital temperature sensor that can be connected directly to a microcontroller interface with only minimal external components.
By contrast, a device such as the BMP280 is commonly used in AMC as example sensor module (see your AMC Core Kit). The BMP280 sensor IC itself is small and not convenient to connect directly on a breadboard. The module places the sensor IC on a breakout board and may include additional circuitry that makes it easier and safer to use in an educational setting.
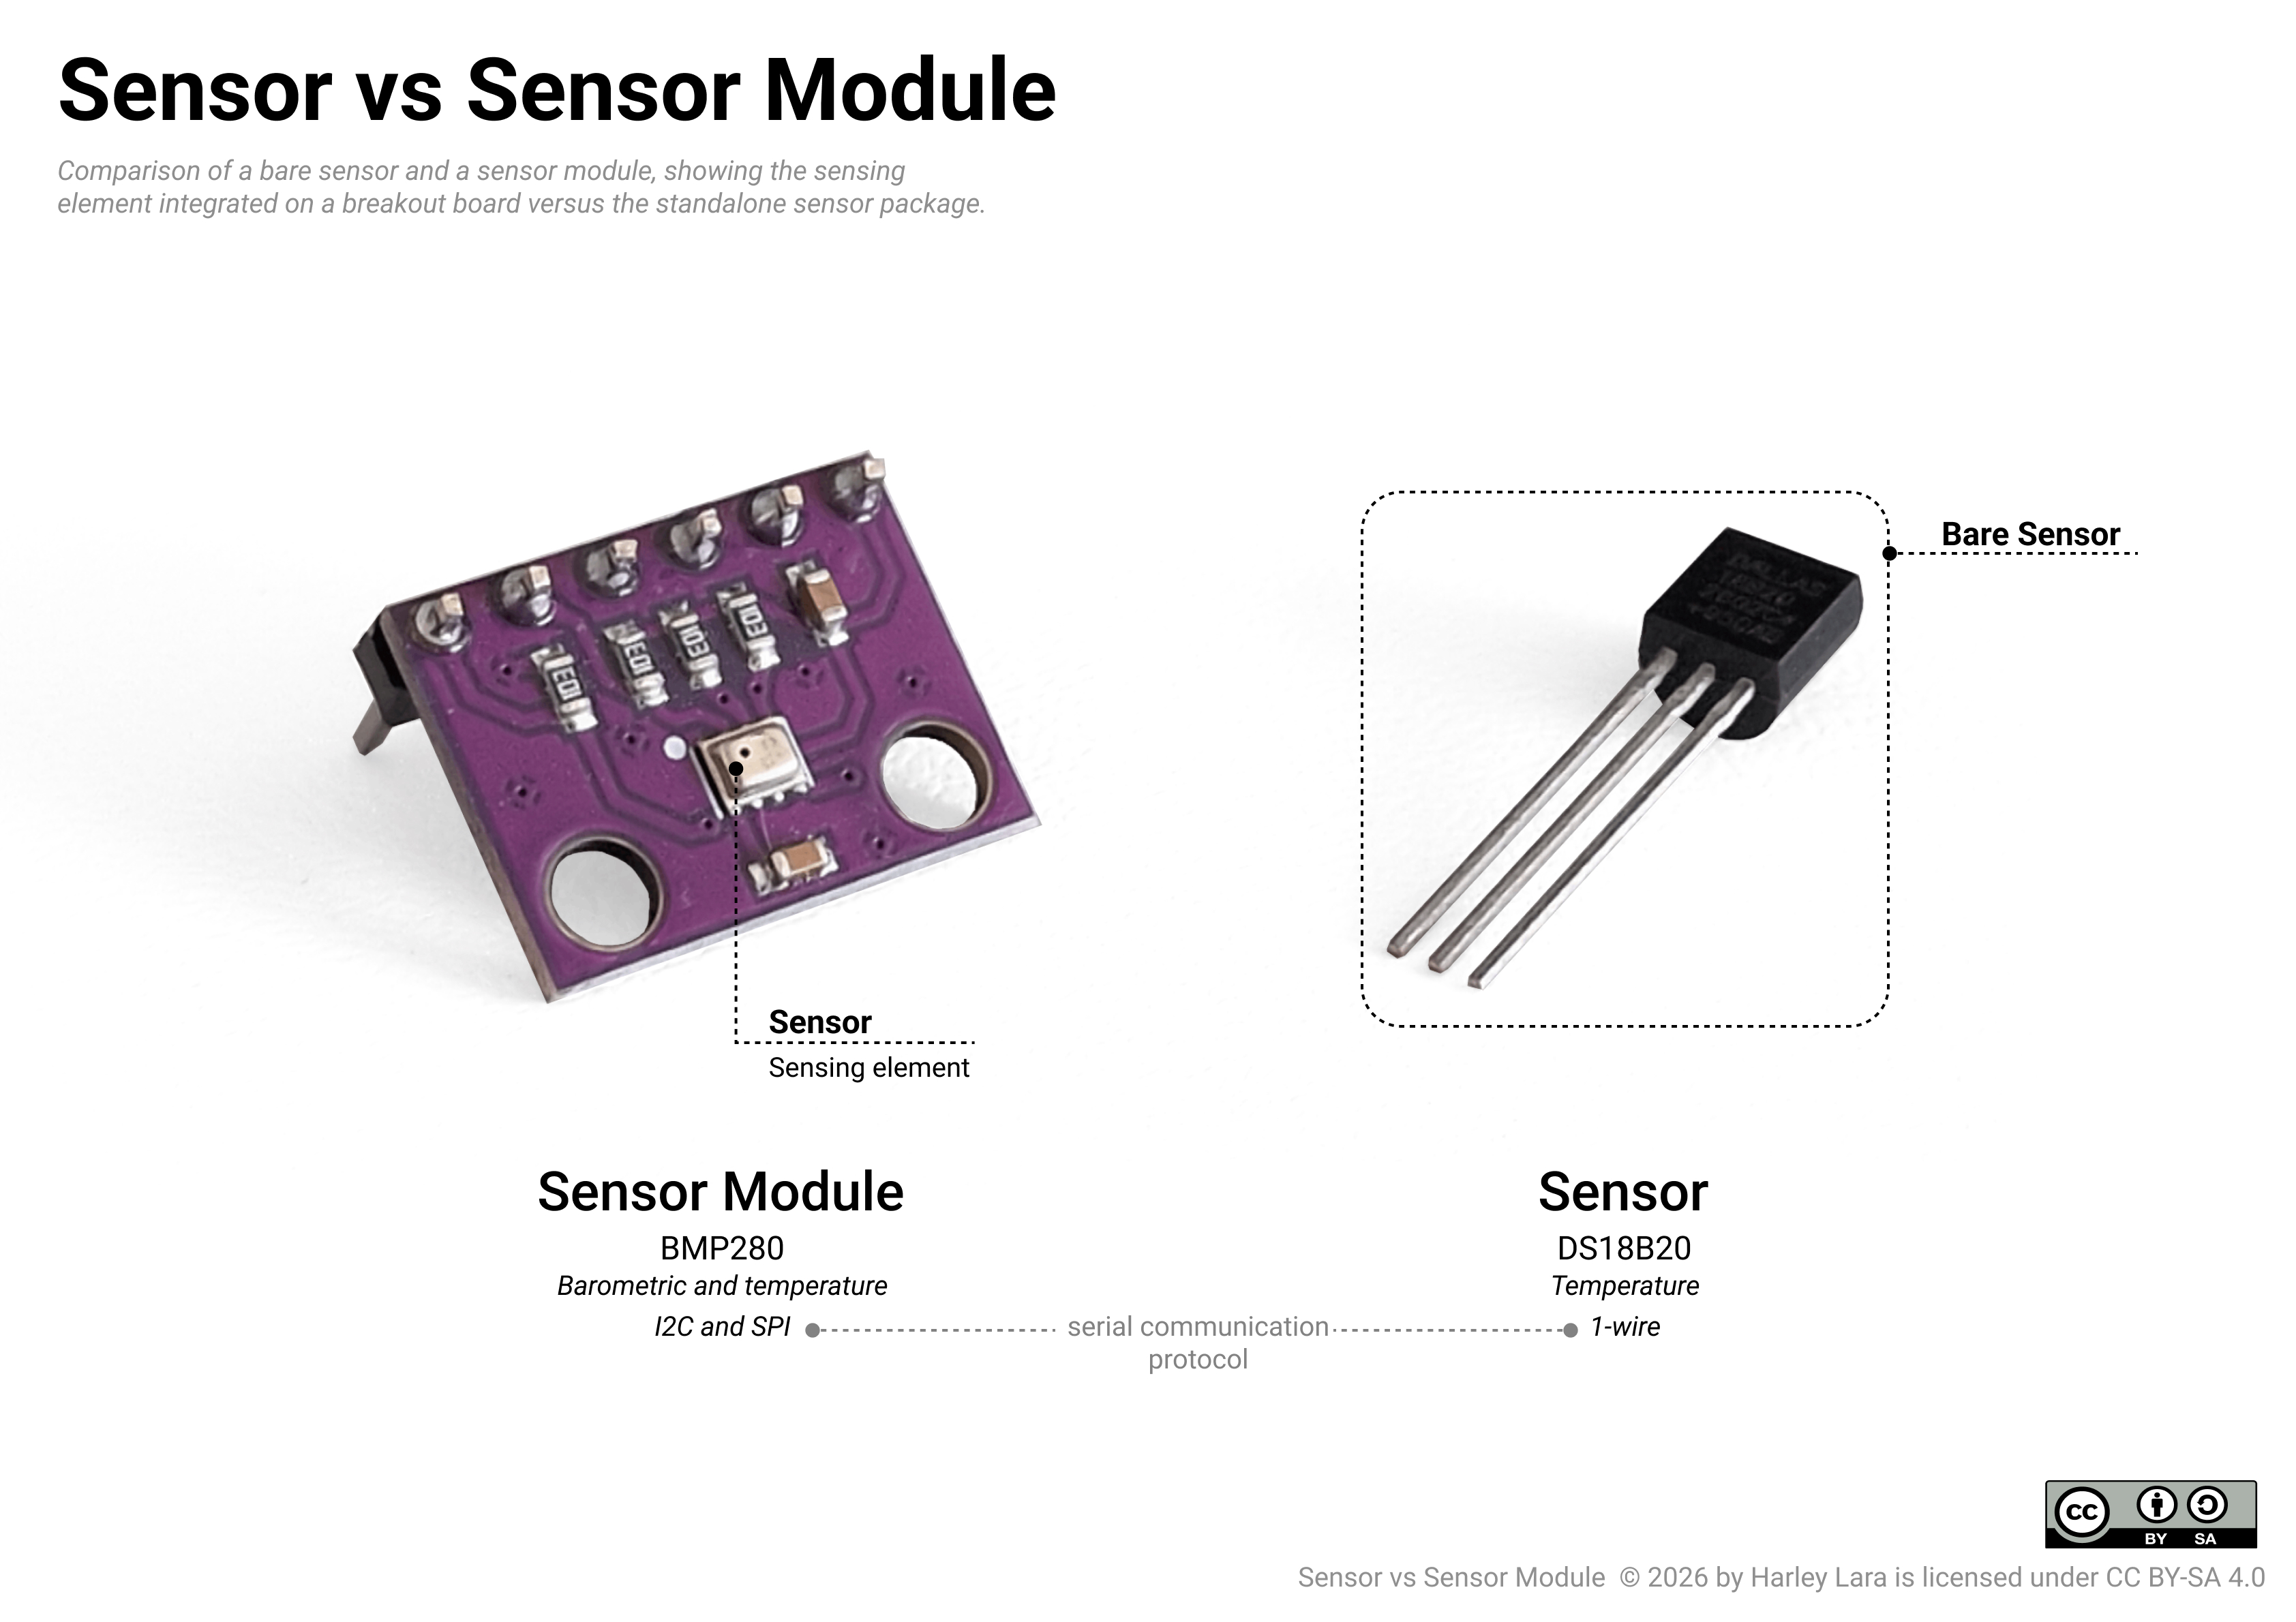 |
|---|
| Visual comparison between a bare sensor and a sensor module. |
In AMC, we mainly use sensor modules unless the sensor is simple enough to be used directly, such as the DS18B20 or the CdS photoresistor. Modules are practical in an educational context and prototyping because they may include supporting components such as:
- voltage regulators,
- level shifters,
- pull-up resistors,
- filter capacitors,
- operational amplifiers,
- comparator circuits,
- connectors,
- and indicator LEDs.
The following image highlights the sensing elements on different sensor modules.
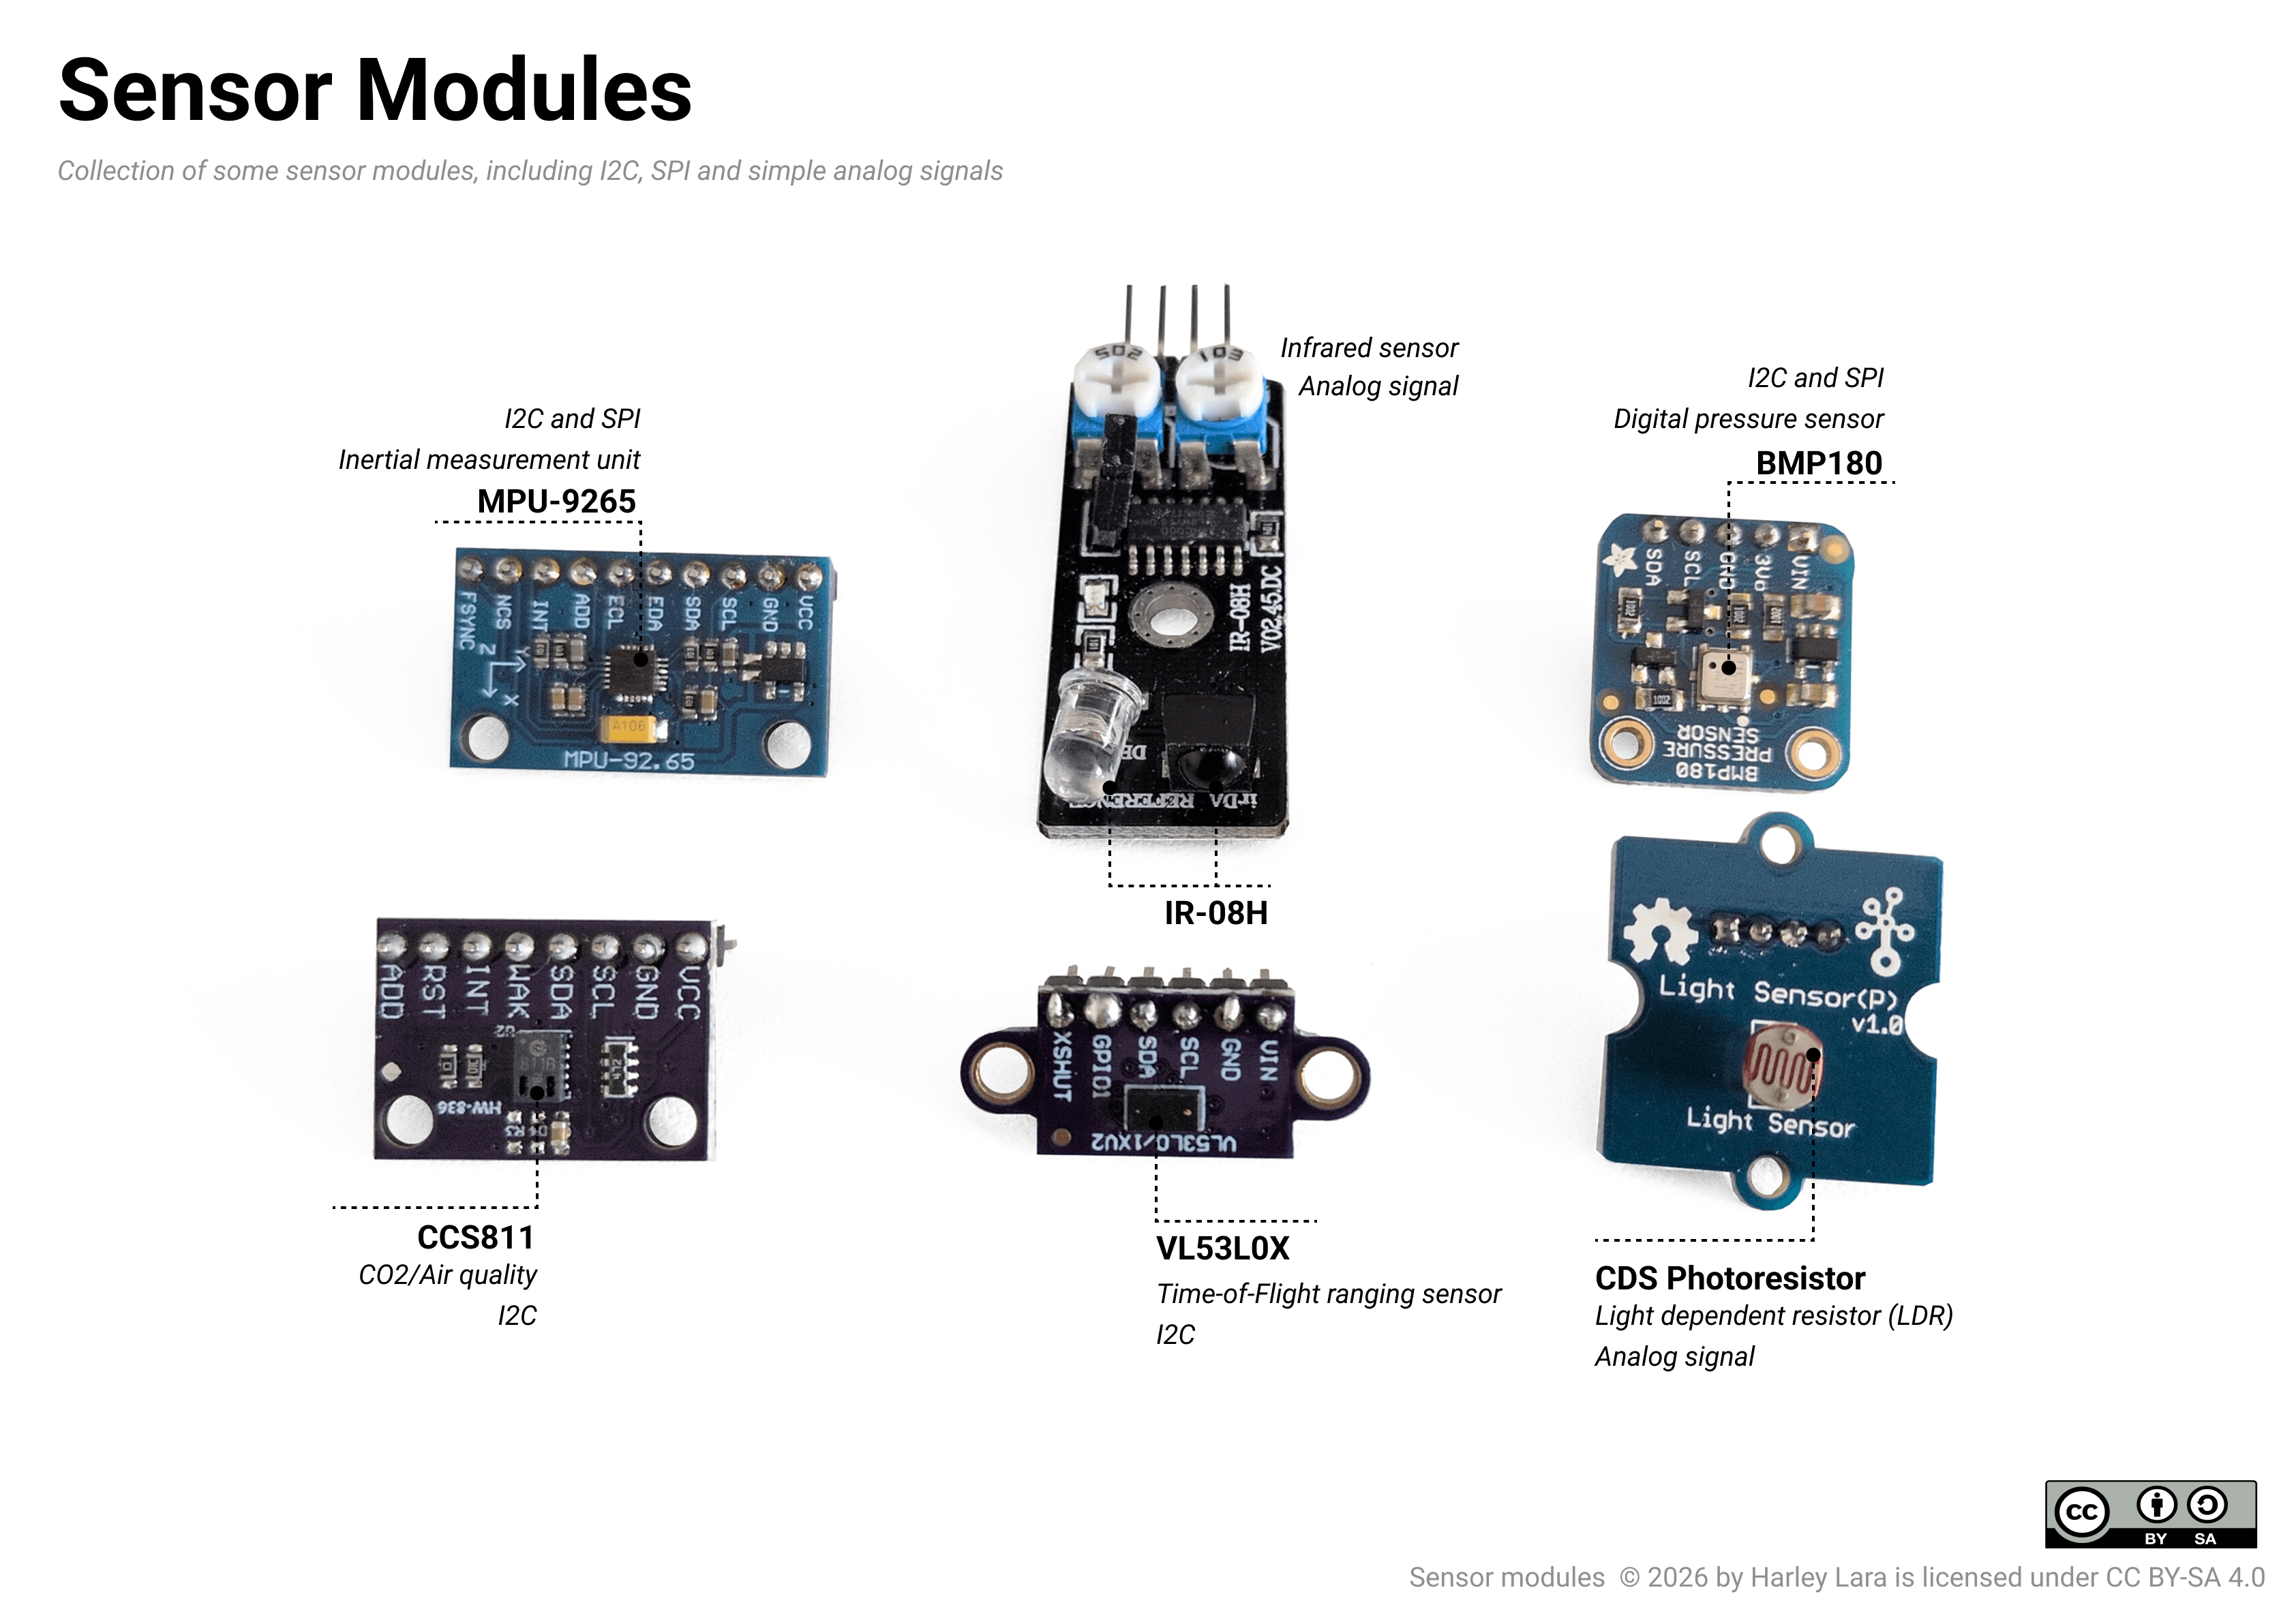 |
|---|
| Examples of sensor modules and their sensing elements. |
Sensor modules are useful because they simplify wiring and reduce the amount of external circuit design required by the user. However, they can also hide important details. Two modules that use the same sensor IC may not behave exactly the same if the surrounding circuitry is different.
For example, a bare analog sensor may require a voltage divider, while a module may already include one. A bare I2C sensor IC may require external pull-up resistors, while a module may already include them. A sensor IC may be designed for 3.3 V operation only, while a module may include a voltage regulator that allows the board to be powered from 5 V.
Therefore, when working with modules, distinguish between:
- the sensor IC,
- the module board,
- the communication interface,
- and the library used in software.
The module is not only the sensor. It is a small circuit built around the sensor.
Putting Everything Together: Anatomy of a Sensor System
A complete sensor system can be understood as a chain of transformations.
A physical variable exists in the environment. A sensing element responds to that variable. The response is converted into an electrical signal. The signal may be conditioned, filtered, amplified, digitized, transmitted, and finally interpreted by software.
A typical sensor system includes the following stages:
| Stage | Purpose |
|---|---|
| Physical variable | The quantity to be measured |
| Sensing element | Responds to the physical variable |
| Transducer output | Converts the response into an electrical quantity |
| Signal conditioning | Makes the signal usable by the next circuit |
| Conversion | Converts analog information into digital data if needed |
| Communication | Transfers the information to the microcontroller |
| Software interpretation | Converts raw data into meaningful values |
| Application logic | Uses the value to make decisions |
For an analog temperature measurement using a thermistor, the chain may look like this:
Temperature
→ thermistor resistance changes
→ voltage divider produces voltage
→ ADC converts voltage to a number
→ software calculates resistance
→ software estimates temperature
→ program uses temperature value
For a digital temperature sensor, the chain may look like this:
Temperature
→ internal sensing element responds
→ internal electronics measure the response
→ internal ADC converts the measurement
→ sensor stores result in registers
→ microcontroller reads registers over I2C
→ software converts raw bytes into temperature
→ program uses temperature value
Both systems measure temperature, but the boundary between hardware and software is different.
In the analog case, the user is more directly responsible for the measurement circuit and conversion formula. In the digital case, more of the measurement process is handled inside the sensor IC, but the user must correctly use the communication protocol and data format.
Practical Reading Strategy
When selecting or using a sensor, start with the signal and interface rather than only with the physical quantity.
A useful sequence of questions is:
- What physical variable does the sensor measure?
- What is the measurement range?
- What is the expected accuracy and resolution?
- What kind of output does the sensor provide?
- Is the output analog, digital, timed, frequency-based, or serial?
- What voltage does the sensor require?
- What voltage levels does the interface use?
- Does the microcontroller need an ADC, timer, GPIO pin, or communication peripheral?
- Does the sensor require calibration?
- What does the datasheet say about converting raw values into physical units?
This approach prevents a common beginner mistake: choosing a sensor because it measures the right variable, but only later discovering that the signal is difficult to read, incompatible with the board, or unsuitable for the required environment.
Summary
A sensor allows a microcontroller system to obtain information about the physical world. The measured quantity may begin as temperature, pressure, light, motion, sound, humidity, or another environmental variable, but it must eventually become an electrical signal or digital data.
The most important distinction is not only what the sensor measures, but how it communicates the measurement.
A sensor may provide:
- an analog voltage,
- a variable resistance,
- a digital logic state,
- a pulse duration,
- a frequency,
- or serial digital data.
Analog signals usually require ADC conversion before software can process them. Digital signals use discrete voltage states, but the information may be encoded as simple logic, timing, or structured serial data. Digital serial sensors often simplify measurement hardware, but they introduce protocol, addressing, and data-format requirements.
In microcontroller programming, reading a sensor is therefore both an electrical task and a software task. The circuit must produce a valid signal, and the program must interpret that signal correctly.
Exercises
In this exercise you will build a simple input circuit using digital and analog components connected to a microcontroller. At this point, you have not yet been introduced to microcontroller programming. For this reason, the teaching team will program the microcontroller for you during the exercise.
For now, you will use the microcontroller as a data collection device. You can treat it as a black box that reads the state of the connected components and sends the measured values to your computer. Later, when we reach the section on "Programming Microcontrollers", we will study the program used in this exercise.
The task here is to wire the circuit correctly, connect the programmed microcontroller to a web terminal, and collect measurement data from:
- A push button as a digital input.
- A potentiometer as an analog input.
- A photoresistor, also called an LDR, as an analog light sensor.
By the end of this exercise you should be able to:
- Wire simple digital and analog input circuits on a breadboard.
- Connect a microcontroller safely after circuit verification.
- Read serial data from a microcontroller using a web terminal.
- Collect sensor measurements systematically and record them in tables.
- Observe how analog input values change in response to physical changes.
E1 Simple Digital and Analog signals
Purpose: To build a circuit with one digital input and two analog inputs, then collect and profile the output values reported by the microcontroller.
Required Core Kit Components:
- Breadboard
- Microcontroller
- USB A to Micro B cable
- 10k, 1k resistor sets
- Photoresistor (LDR)
- 10k Potentiometer
- Push button
- Jumper cables
Additional Component:
- Program to flash into the microcontroller (will be provided during the exercise).
Before you start:
⚠️ IMPORTANT NOTE
Do not connect the USB cable to the microcontroller until your circuit has
been checked and approved by the teaching team.
Incorrect wiring can damage the components or the microcontroller. Please ask for verification before powering up the system.
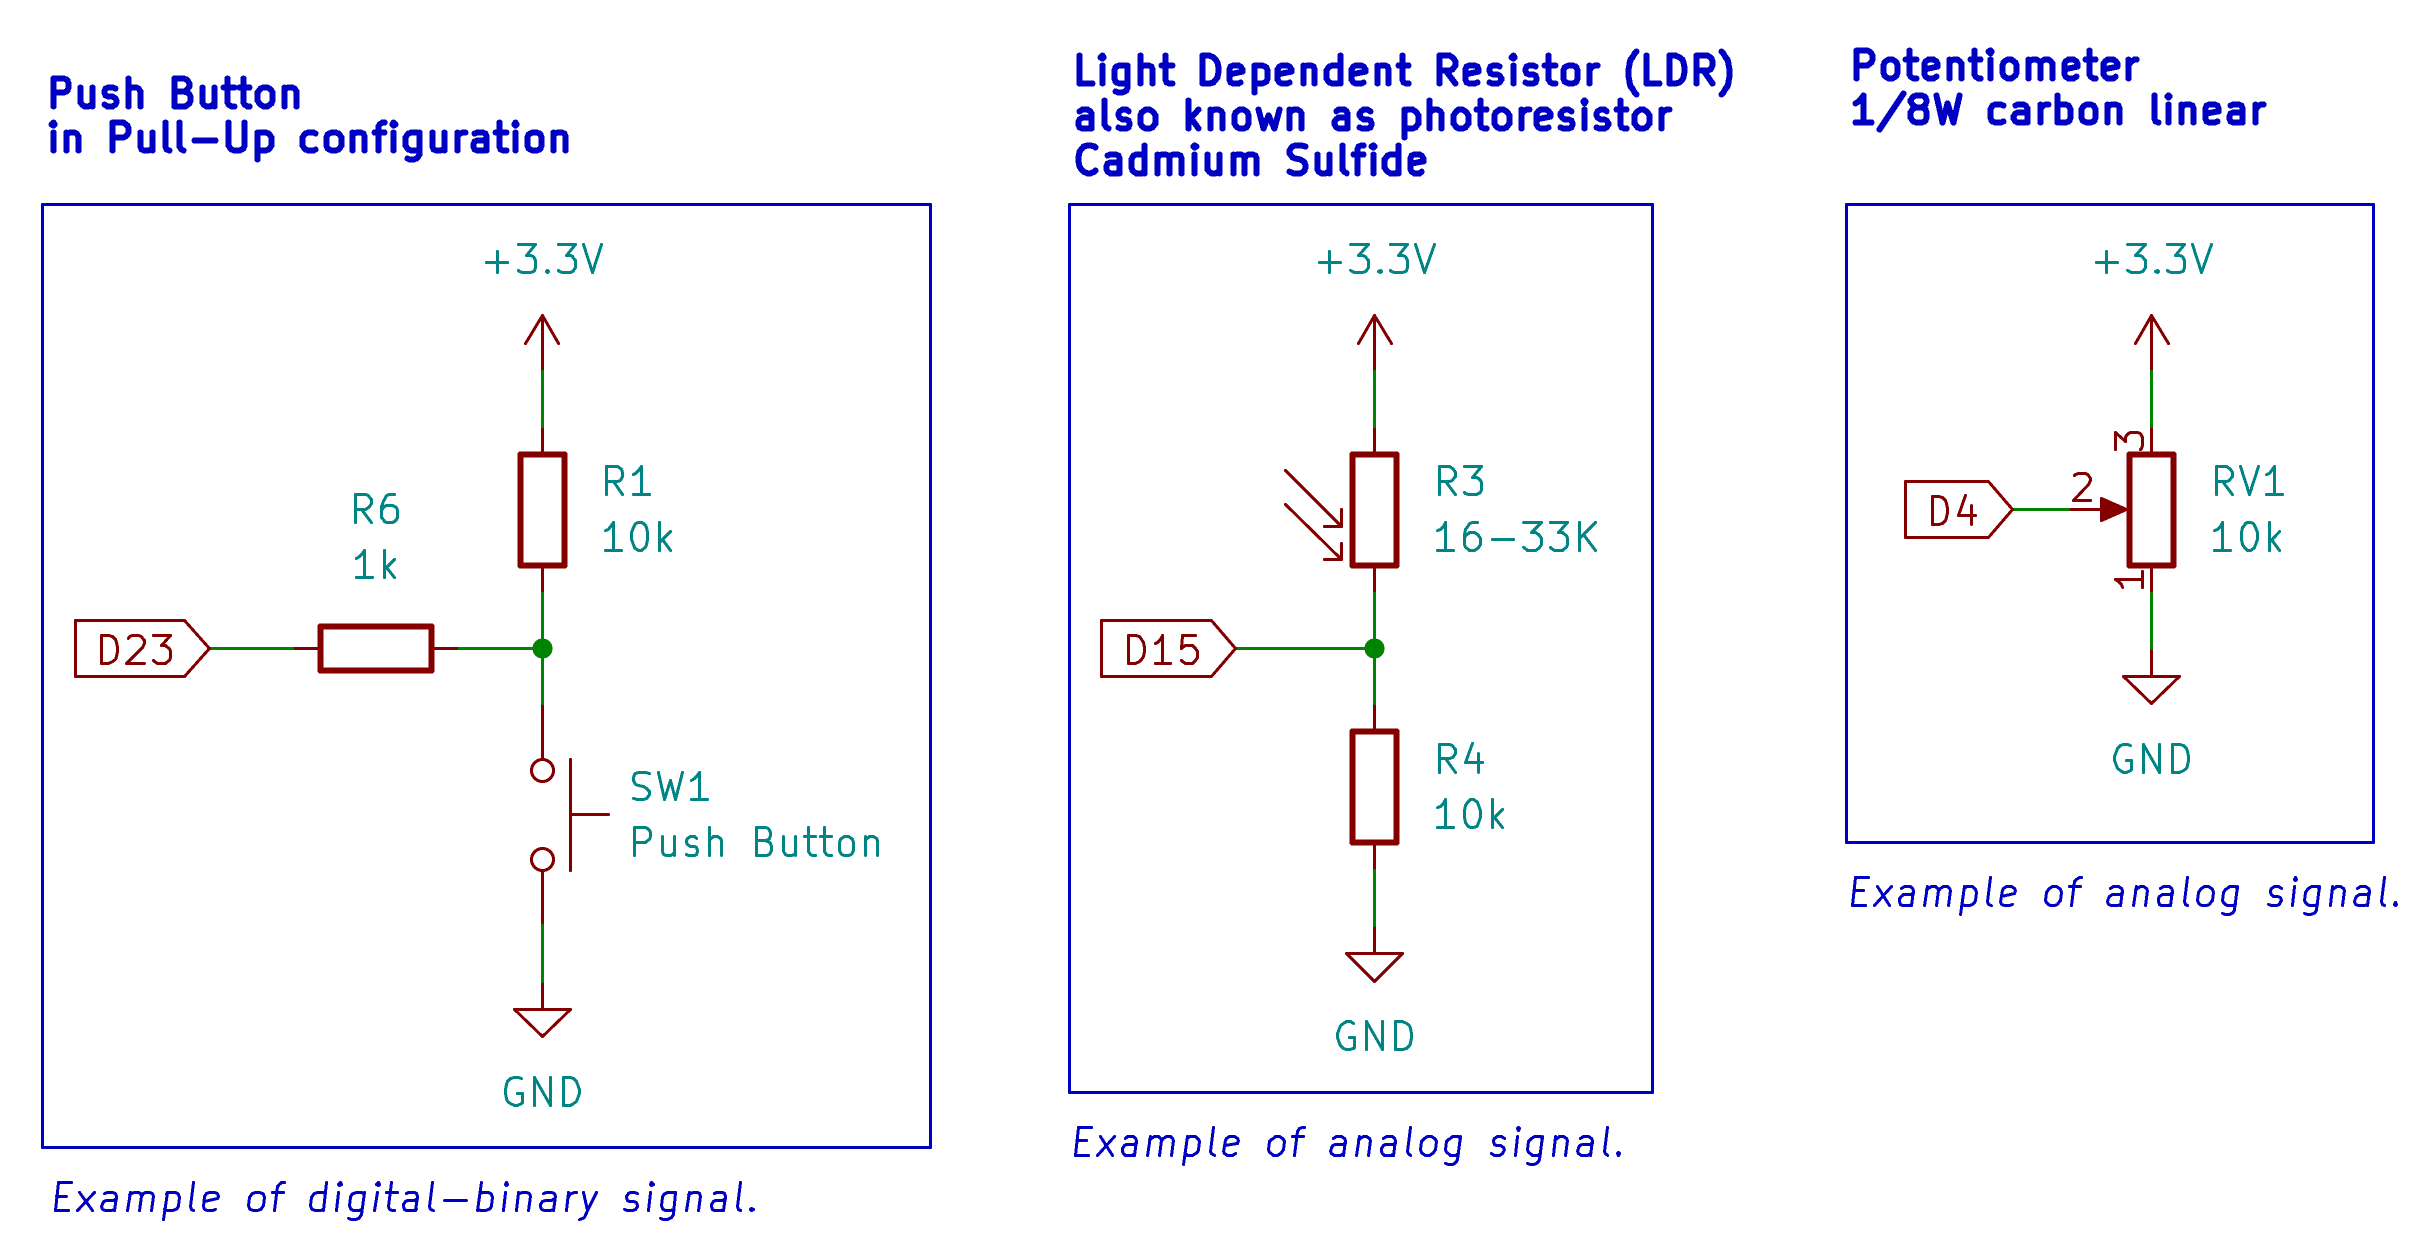 |
|---|
| Circuit to be assembled on your breadboard. |
-
Wire the complete circuit shown above on your breadboard. This time, all components must be placed on the same breadboard at the same time. While you are wiring the circuit, the teaching team will go around and flash the required program into each microcontroller.
-
Once you have finished wiring, call the teaching team to verify your circuit. Depending on the number of students, you may need to wait before your circuit can be checked.
-
Once your circuit has been fully verified and the microcontroller has been programmed, connect the microcontroller to your computer using the provided USB cable. If your computer does not detect the microcontroller, you may be missing the required driver. Please download the driver for you operating system from this website CP210x USB to UART Bridge VCP Drivers.
-
Open the following page: AMC Simple Web Terminal, and connect to the microcontroller through the web terminal.
The web terminal should print three values separated by commas:
button_state, ldr_value, potentiometer_value
for example:
0, 742, 318
The exact values will depend on the state of your button, the amount of light reaching the LDR, and the position of the potentiometer.
E1.1 Profiling the Potentiometer
Purpose: To collect a response curve for the full rotation range of the potentiometer.
Your task is to rotate the potentiometer in small, consistent angle increments and record the output value shown in the web terminal.
It is important that you perform the measurements carefully. Use approximately equal angle increments. Do not choose the next position based on the output value, because this would bias your measurements.
| index | Potentiometer value |
|---|---|
| 1 | |
| 2 | |
| 3 | |
| .... |
- Set the potentiometer to its minimum position.
- Record into the table the potentiometer value printed in the web terminal.
- Rotate the potentiometer by a small and consistent angle increment.
- Record the new potentiometer value.
- Repeat until you reach the maximum position of the potentiometer.
- Add as many readings as you consider appropriate. More measurements with smaller angle increments will give you a higher-resolution profile.
Checkpoint!: At this point, you should have a table containing the potentiometer values across its full rotation range.
add as many reading as you think apropiate, more measruments with small angle increments translate in higher resolution sampling.
E1.2 Profiling the LDR
Purpose: To collect a response profile for the LDR under different light conditions.
Your task is to expose the LDR to different light levels and record the output value shown in the web terminal.
Try to create a controlled sequence of light conditions. For example, you may start with the LDR fully covered, then gradually increase the amount of light reaching it.
| index | Light condition | LDR value |
|---|---|---|
| 1 | Fully covered | |
| 2 | Mostly covered | |
| 3 | Partially covered | |
| 4 | Room light | |
| 5 | Direct light |
- Start with the LDR fully covered.
- Record in the table the LDR value printed in the web terminal.
- Increase the amount of light reaching the LDR in a controlled way.
- Record the new LDR value.
- Repeat for several different light conditions.
- Avoid sudden or inconsistent changes in lighting while taking a reading.
- If the value fluctuates, wait briefly and record a representative stable value.
Checkpoint!: At this point, you should have one table for the potentiometer profile and one table for the LDR profile.
E1.3 Observing the Push Button
Purpose: To observe the difference between a digital input and the analog inputs measured previously.
The push button has only two expected states: not pressed and pressed. In the web terminal, observe how the button value changes when you press and release the button.
| Measurement | Push-button state | Button value |
|---|---|---|
| 1 | Not pressed | |
| 2 | Pressed | |
| 3 | Not pressed | |
| 4 | Pressed |
- Leave the push button unpressed and record the button value.
- Press and hold the push button, then record the button value.
- Release the button and record the value again.
- Repeat the measurement a few times to confirm that the value changes consistently.
Assignment
This assignment focuses on analysing the data collected during the exercise. Your goal is not only to describe what happened, but to explain why the measured values behaved as they did and to evaluate how reliable your measurements are.
Use your own recorded data from the potentiometer, LDR, and push button. Your discussion should refer directly to your tables and plots.
A1 Experimental Setup and Limitations
Discuss the measurement setup as an experimental system.
Your answer should explain how the physical circuit, the microcontroller, and the web terminal work together to convert physical actions into numerical data. In your discussion, identify the main weaknesses of this setup as a measurement system.
Consider issues such as:
- Manual control of the potentiometer position.
- Manual control of the light level reaching the LDR.
- Ambient light, shadows, reflections, and hand position.
- Contact quality in the breadboard and jumper wires.
- Delay between changing the input condition and recording the value.
- Limited resolution of the microcontroller analog input.
Do not only list possible flaws. Explain which limitations most likely affected your own measurements and how they would appear in the recorded data or plotted curves.
A2 Interpretation of the Measured Values
Explain why the three inputs produced different types of numerical behaviour.
Your discussion should include the following:
-
Potentiometer Explain why rotating the potentiometer changes the value reported by the microcontroller. Relate your explanation to the idea of a voltage divider and to the voltage being read at the analog input.
-
LDR Explain why changing the light level changes the LDR reading. Relate your explanation to the resistance of the LDR, the voltage divider circuit, and the voltage measured by the microcontroller.
-
Push button Explain why the push button behaves differently from the potentiometer and the LDR. Discuss why it produces a limited set of states instead of a continuous range of values.
-
Analog-to-digital conversion The microcontroller does not directly report a voltage. It reports a numerical value obtained from an analog-to-digital conversion. Explain what this means and how it affects the precision and interpretation of your measurements.
A3 Potentiometer Response Curve
Using Microsoft Excel, LibreOffice Calc, Google Sheets, or similar software, plot the potentiometer response.
Use:
- x-axis: Measurement index or potentiometer position.
- y-axis: Potentiometer value reported by the web terminal.
Suggested title:
Potentiometer Response Curve
After plotting the curve, write a short analysis.
Your analysis should explain the shape of the curve and what it reveals about the relationship between potentiometer position and measured value. Discuss whether the response appears approximately linear, where the curve behaves as expected, and where it does not.
If your curve contains jumps, flat regions, irregular spacing, or unexpected values, explain what may have caused them. Relate your explanation to the measurement method, not only to the component itself.
A4 LDR Response Curve
Using Microsoft Excel, LibreOffice Calc, Google Sheets, or similar software, plot the LDR response.
Use:
- x-axis: Measurement index or light condition.
- y-axis: LDR value reported by the web terminal.
Suggested title:
LDR Response Curve
After plotting the curve, write a short analysis.
Your analysis should explain how the LDR reading changes with light level and why this response is expected to be less controlled than the potentiometer response. Discuss whether the curve appears linear or non-linear, and explain what this suggests about the behaviour of the LDR and the voltage divider circuit.
Use your data to identify where the LDR was most sensitive to changes in light and where changes in light produced only small changes in the measured value. Discuss possible reasons for fluctuations or inconsistent readings.
A5 Discussion of Results
Compare the potentiometer, LDR, and push button as input devices.
Your discussion should explain what this experiment demonstrates about the difference between analog and digital signals. Use your measured data to support your explanation.
In your answer, compare:
- The predictability of each input.
- The repeatability of the measurements.
- The effect of environmental conditions.
- The difficulty of interpreting the recorded values.
- The usefulness of each input type in a microcontroller system.
End your discussion by explaining how the experiment could be improved if the goal were to obtain more accurate and repeatable response curves.
Submission Requirements
Submit the following:
- Completed potentiometer measurement table.
- Completed LDR measurement table.
- Completed push-button measurement table.
- Potentiometer response plot.
- LDR response plot.
- Written analysis for sections A1 to A5.
Your answers should be written in full paragraphs. Avoid one-sentence answers and avoid repeating the procedure. Focus on explanation, interpretation, and evidence from your own data.